Bitcoin (BTC) may be down 70% from its November 2021 peak, but its rebound move in the past three weeks is raising the possibility of more upside in Q3.
Bitcoin eyes 30% price rally
At the core of the bullish argument is a technical pattern called the “Adam-and-Eve double bottom.”
Notably, the structure appears when the price forms two bottom-and-recovery cycles. The first cycle, called “Adam,” features a pointed bottom, while the other, called the “Eve,” is round-shaped. Also, the peaks of both cycles form a common resistance line.
The Adam-and-Eve pattern resolves after the price breaks above the resistance line, accompanied by a rise in trading volume.
As a rule of technical analysis, the breakout’s target typically comes at a length equal to the maximum distance between the pattern’s lowest point and resistance line.
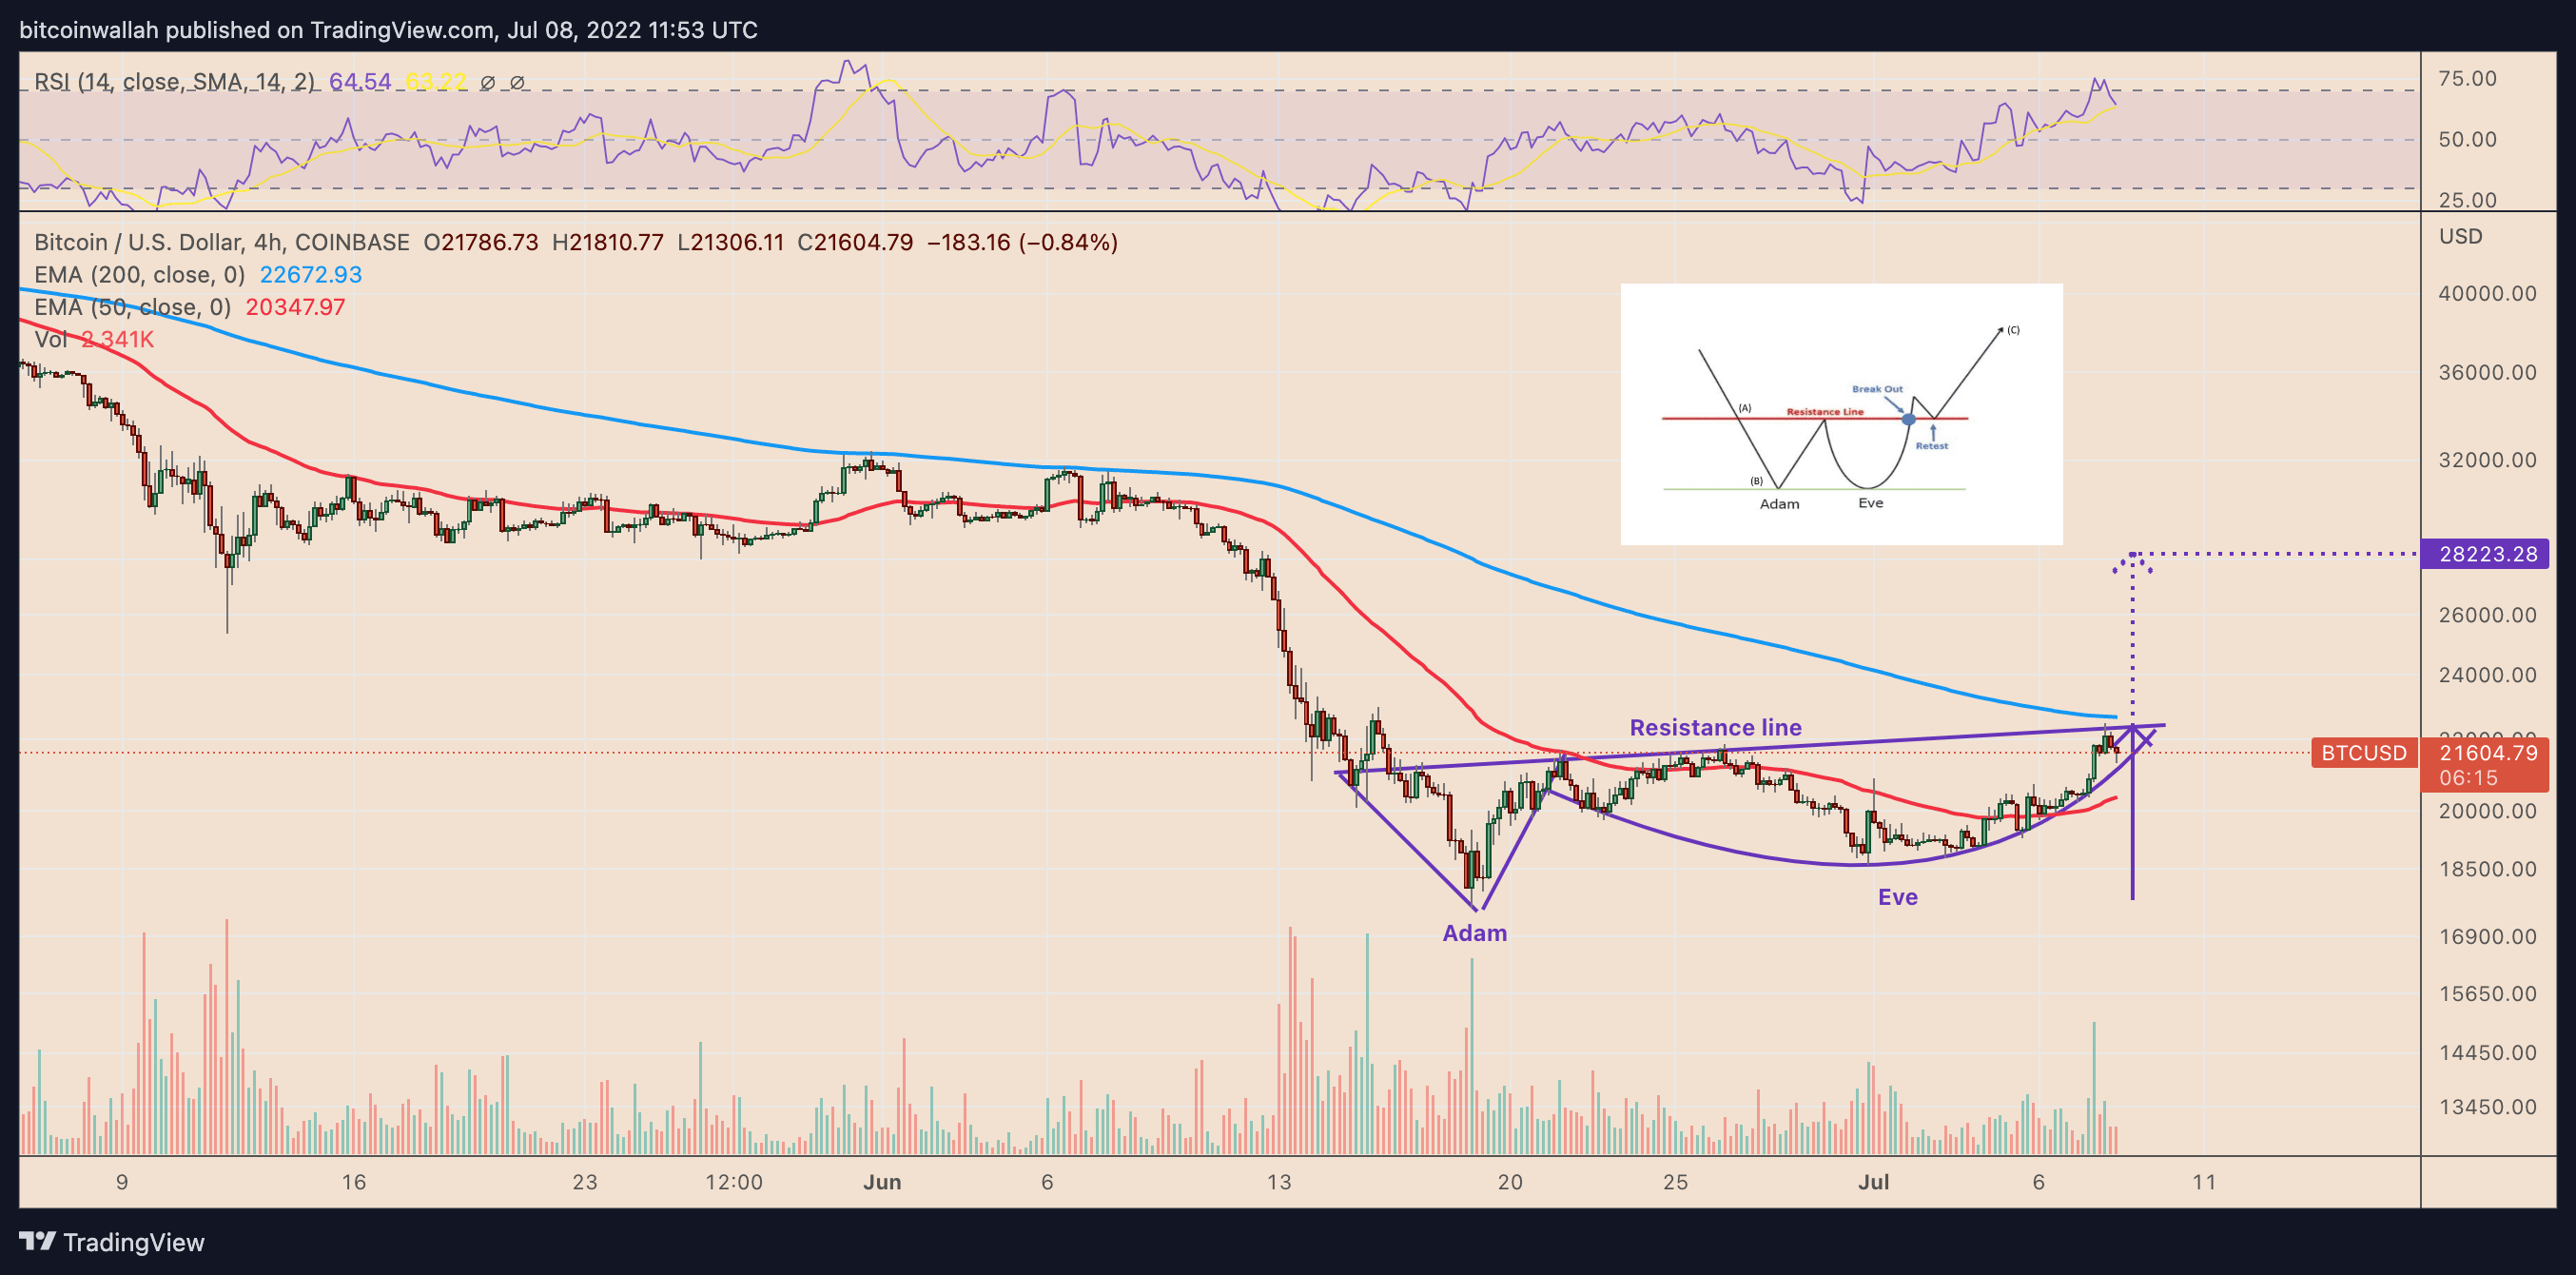 BTC/USD four-hour price chart featuring Adam-and-Eve pattern. Source: TradingView
Given the technical descriptions, BTC/USD has been nearing an Adam-and-Even pattern breakout. Suppose the price closes above the structure’s resistance line. Then, its likelihood of continuing its rally toward $28,000-$28,500 will be higher.
That amounts to over 30% rally in Q3/2022 when measured from current price level.
Conflicting price signal targets $16K
On larger timeframes, however, the Adam-and-Even bullish structure appears in conflict with another technical setup that suggests more pain for Bitcoin in the days ahead.
Dubbed “ascending triangle,” the continuation pattern forms when the price consolidates inside a horizontal trendline resistance and rising trendline support, following a sharp move higher or lower.
Related: Bitcoin price builds best weekly candle since March despite new DXY peak
Interestingly, it appears to be forming on the daily-candle chart after Bitcoin’s downtrend, suggesting more downside is likely as price meets overhead resistance, as shown in the chart below.
 BTC/USD daily price chart featuring ascending triangle pattern. Source: TradingView
The ascending triangle’s bearish scenario eyes the $16,000-$20,000 range depending on the breakdown point.
The views and opinions expressed here are solely those of the author and do not necessarily reflect the views of Cointelegraph.com. Every investment and trading move involves risk, you should conduct your own research when making a decision.