Ethereum’s price has been oscillating in a very tight range over the past couple of weeks as the markets were heading into the new year’s holidays. However, a decisive move may be on the horizon, as the cryptocurrency now resides in a critical area.
Technical Analysis
By: Edris
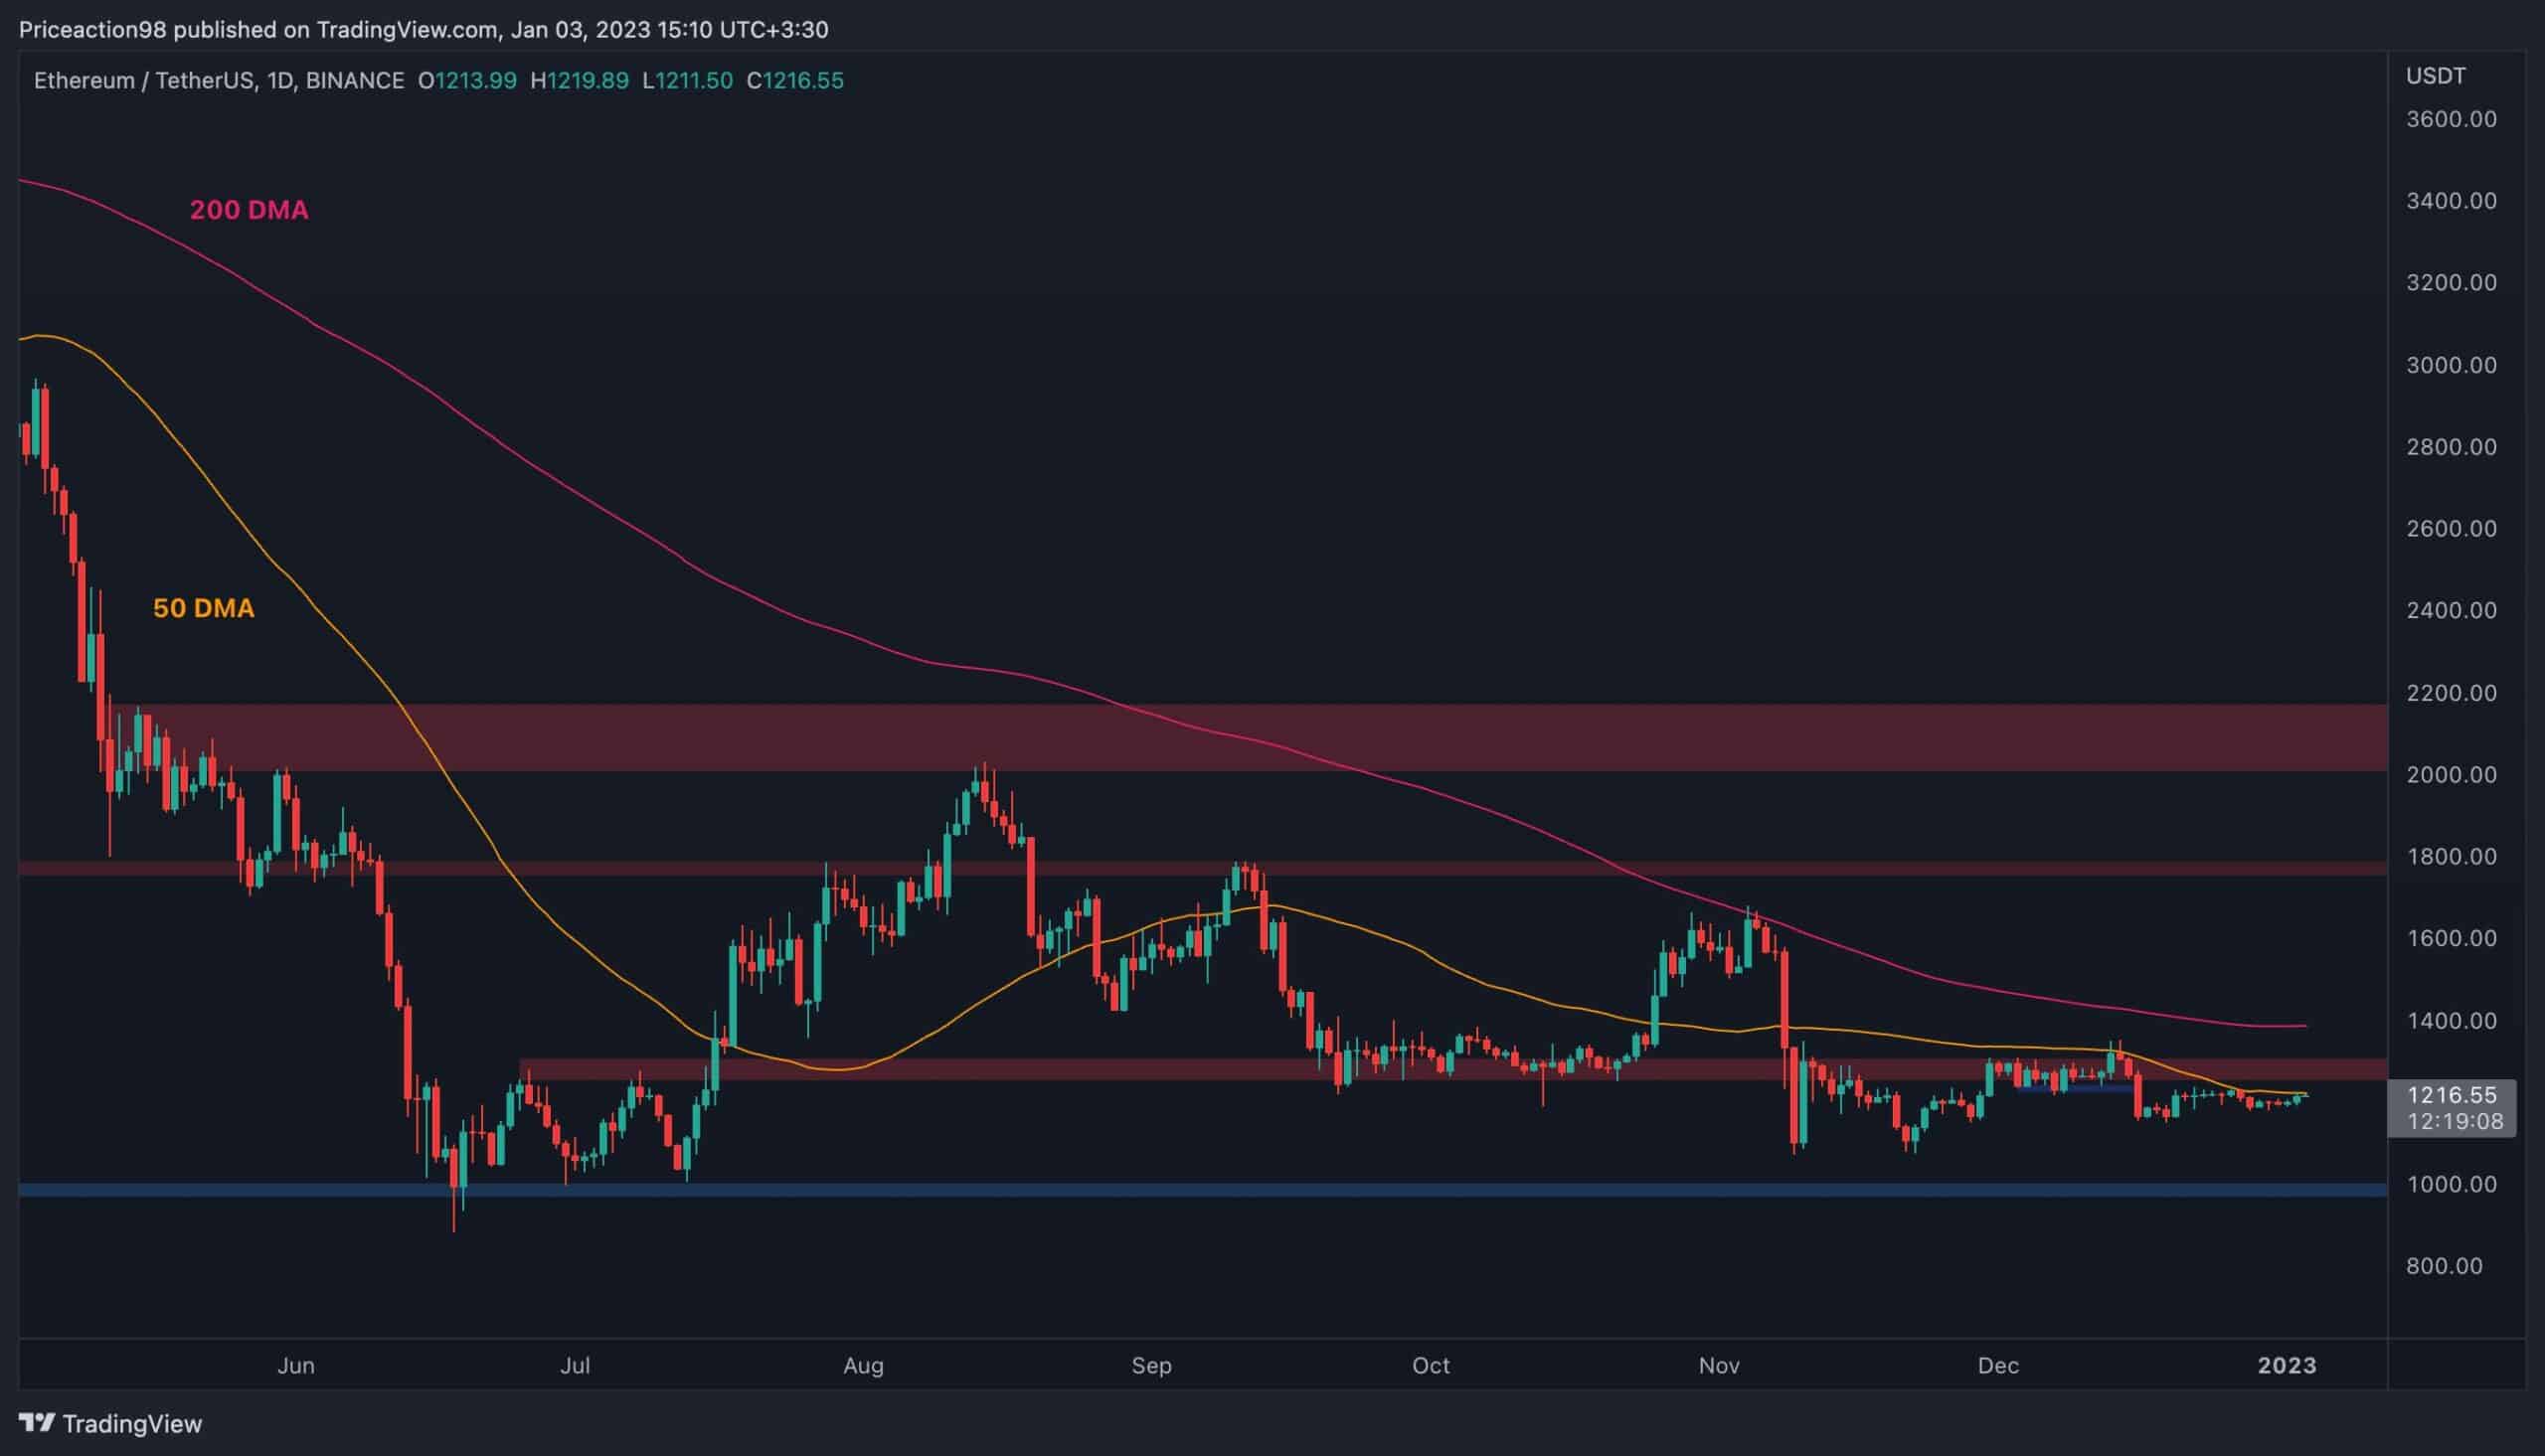
The Daily Chart:
On the daily chart, the price has been testing a significant resistance level recently, where the $1250 zone and the 50-day moving average have a confluence.
While the market is yet to break this fundamental level to the upside, a potential bullish breakout would pave the way for a rise toward the 200-day moving average, around a psychologically significant price the $1400. A valid breakout from the mentioned 200-day MA would likely lead to a short-term rally which can drive ETH’s price toward $1800.
On the other hand, if the price gets rejected to the downside from the $1250 level and the 50-day moving average, a rapid decline toward the bulls’ last resort, which is the $1000 support level, would be more likely.
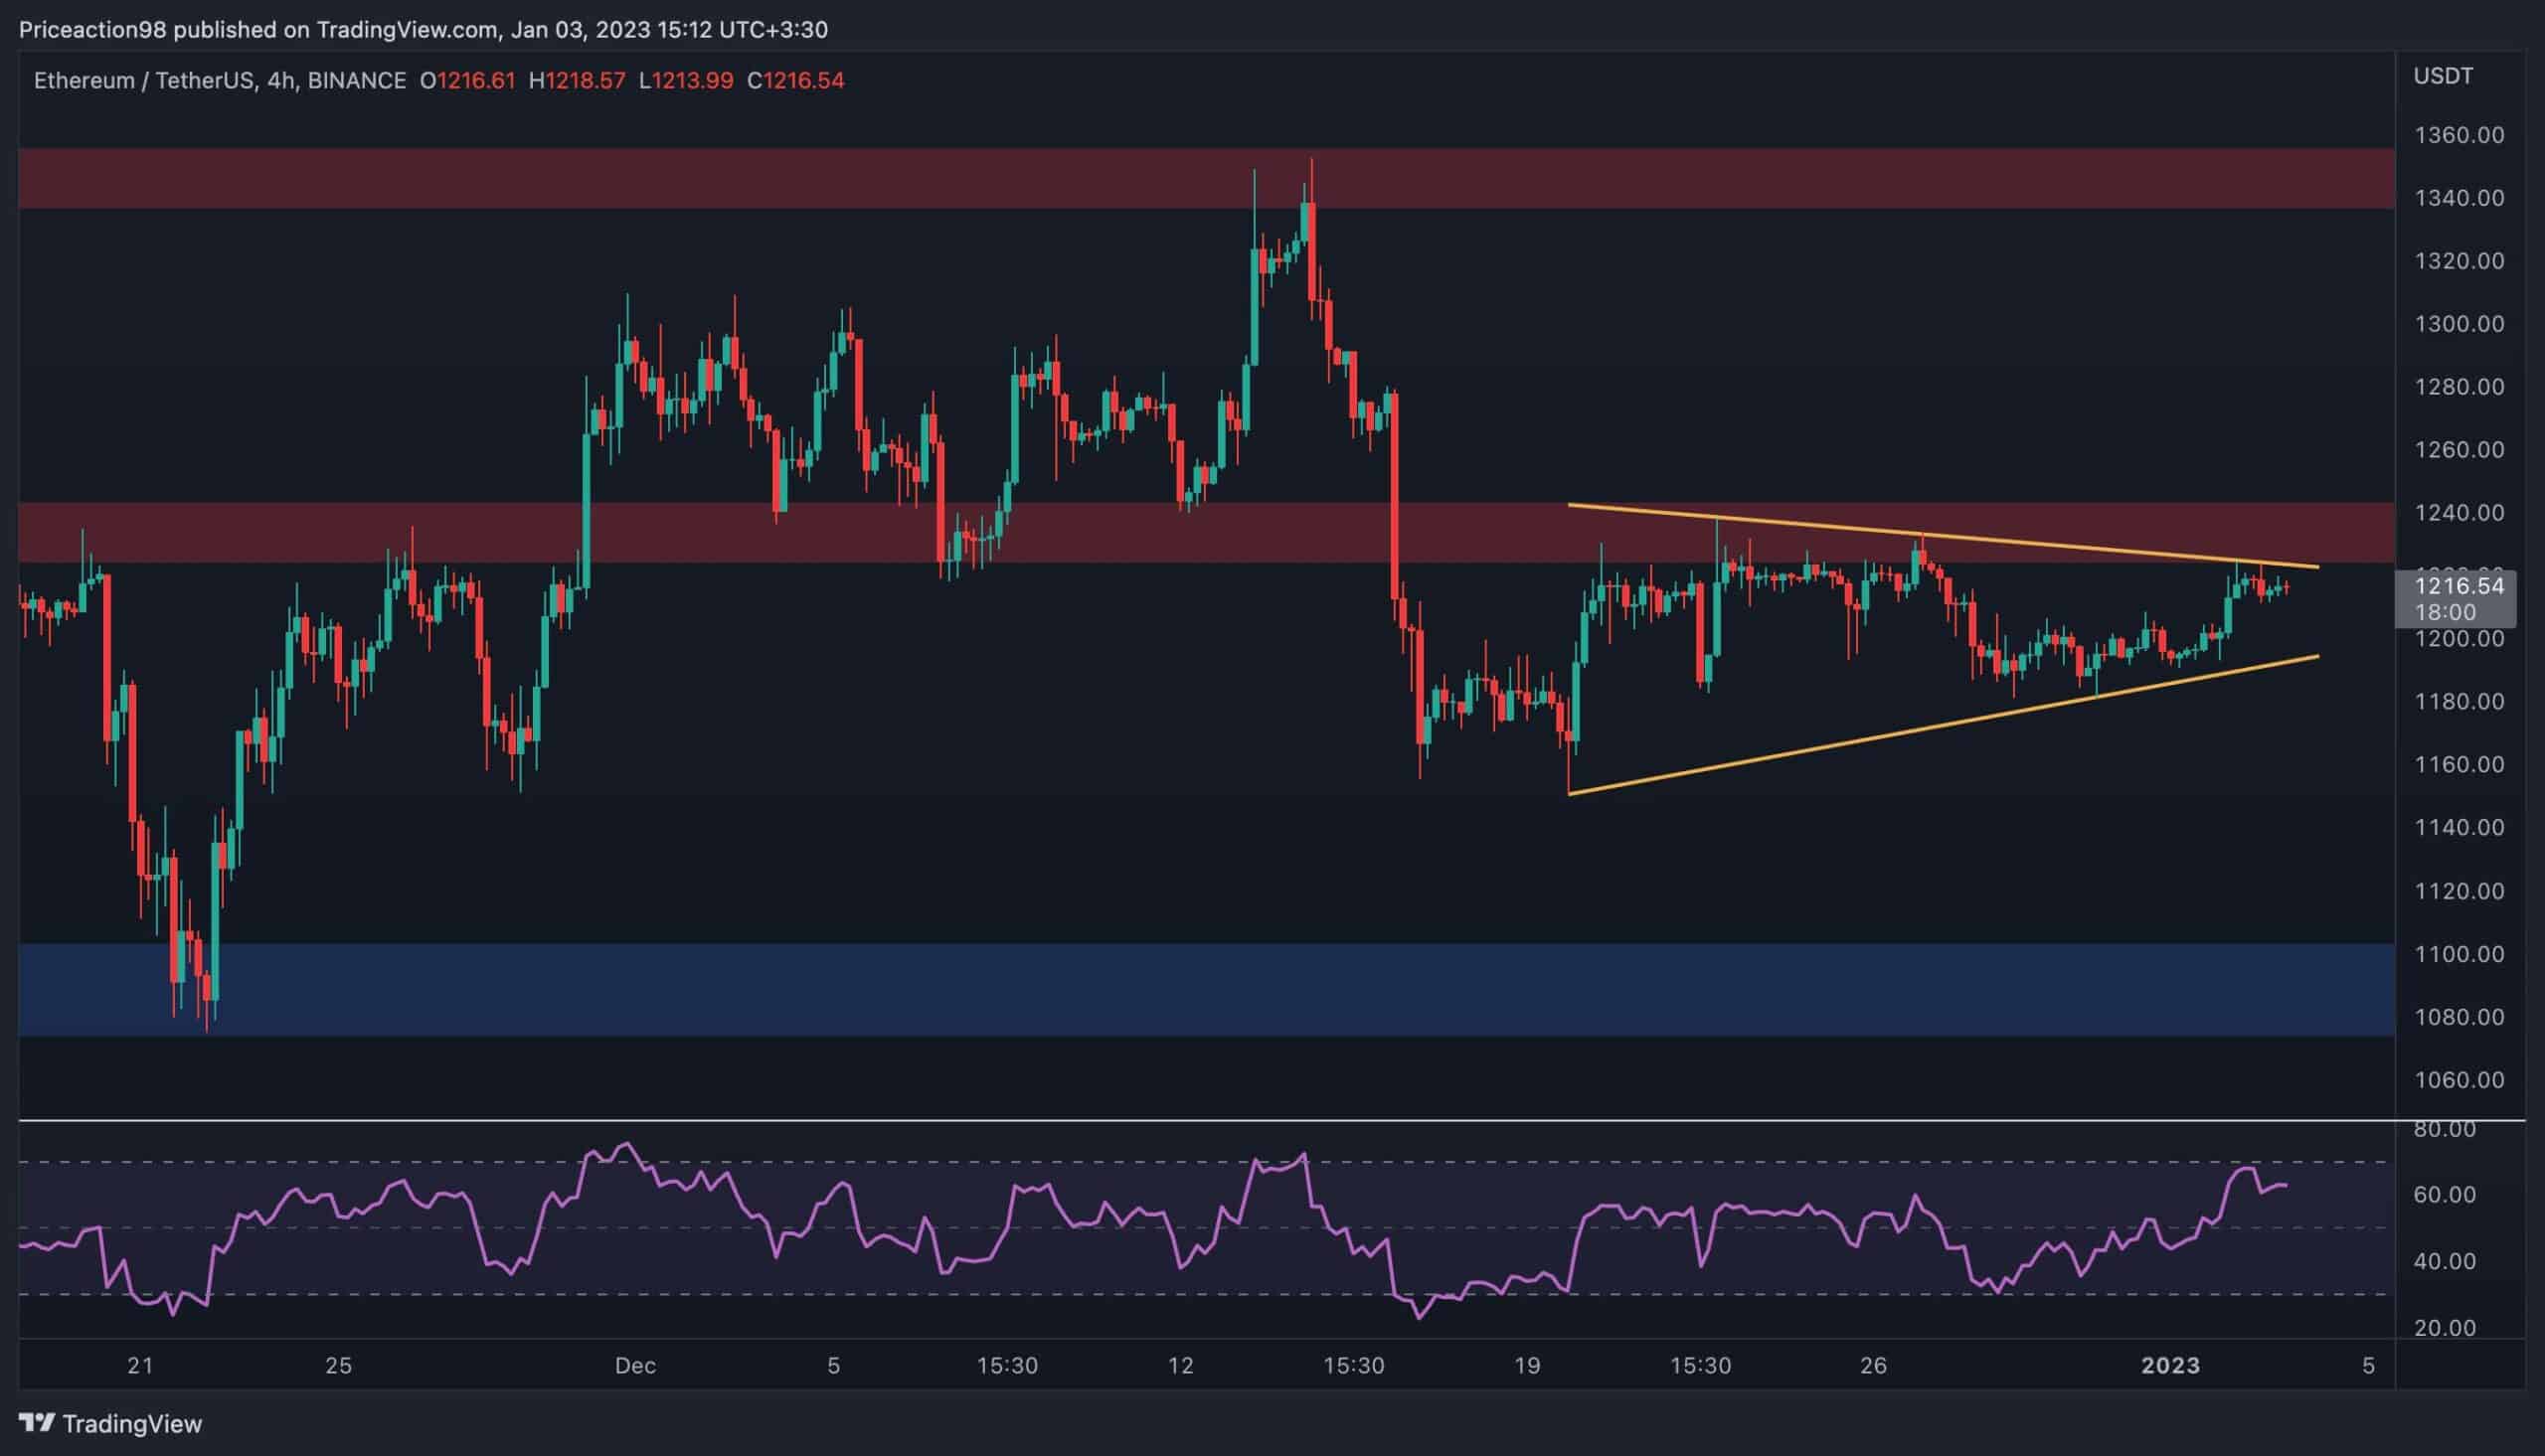
The 4-Hour Chart:
Looking at the 4-hour timeframe, the recent consolidation pattern has become more evident, as the price has bounced inside a symmetrical triangle forming below the $1250 mark. A valid breakout from either side of the pattern could lead to a further continuation in the direction of the initial breakout.
The $1350 resistance zone would be the likely target for a bullish breakout, while a break below the pattern could potentially lead to a drop toward the $1100 support level.
The RSI indicator can also provide helpful insight, as the momentum is approaching the overbought area, and a potential bearish divergence could form soon, signaling a high probability for a bearish reversal. All in all, the market’s short-term future is still hanging in the balance, yet a breakout or rejection from the $1250 level could shape the short-term to mid-term price trend, as liquidity will soon return to the markets after the holidays.
Sentiment Analysis
By: Edris
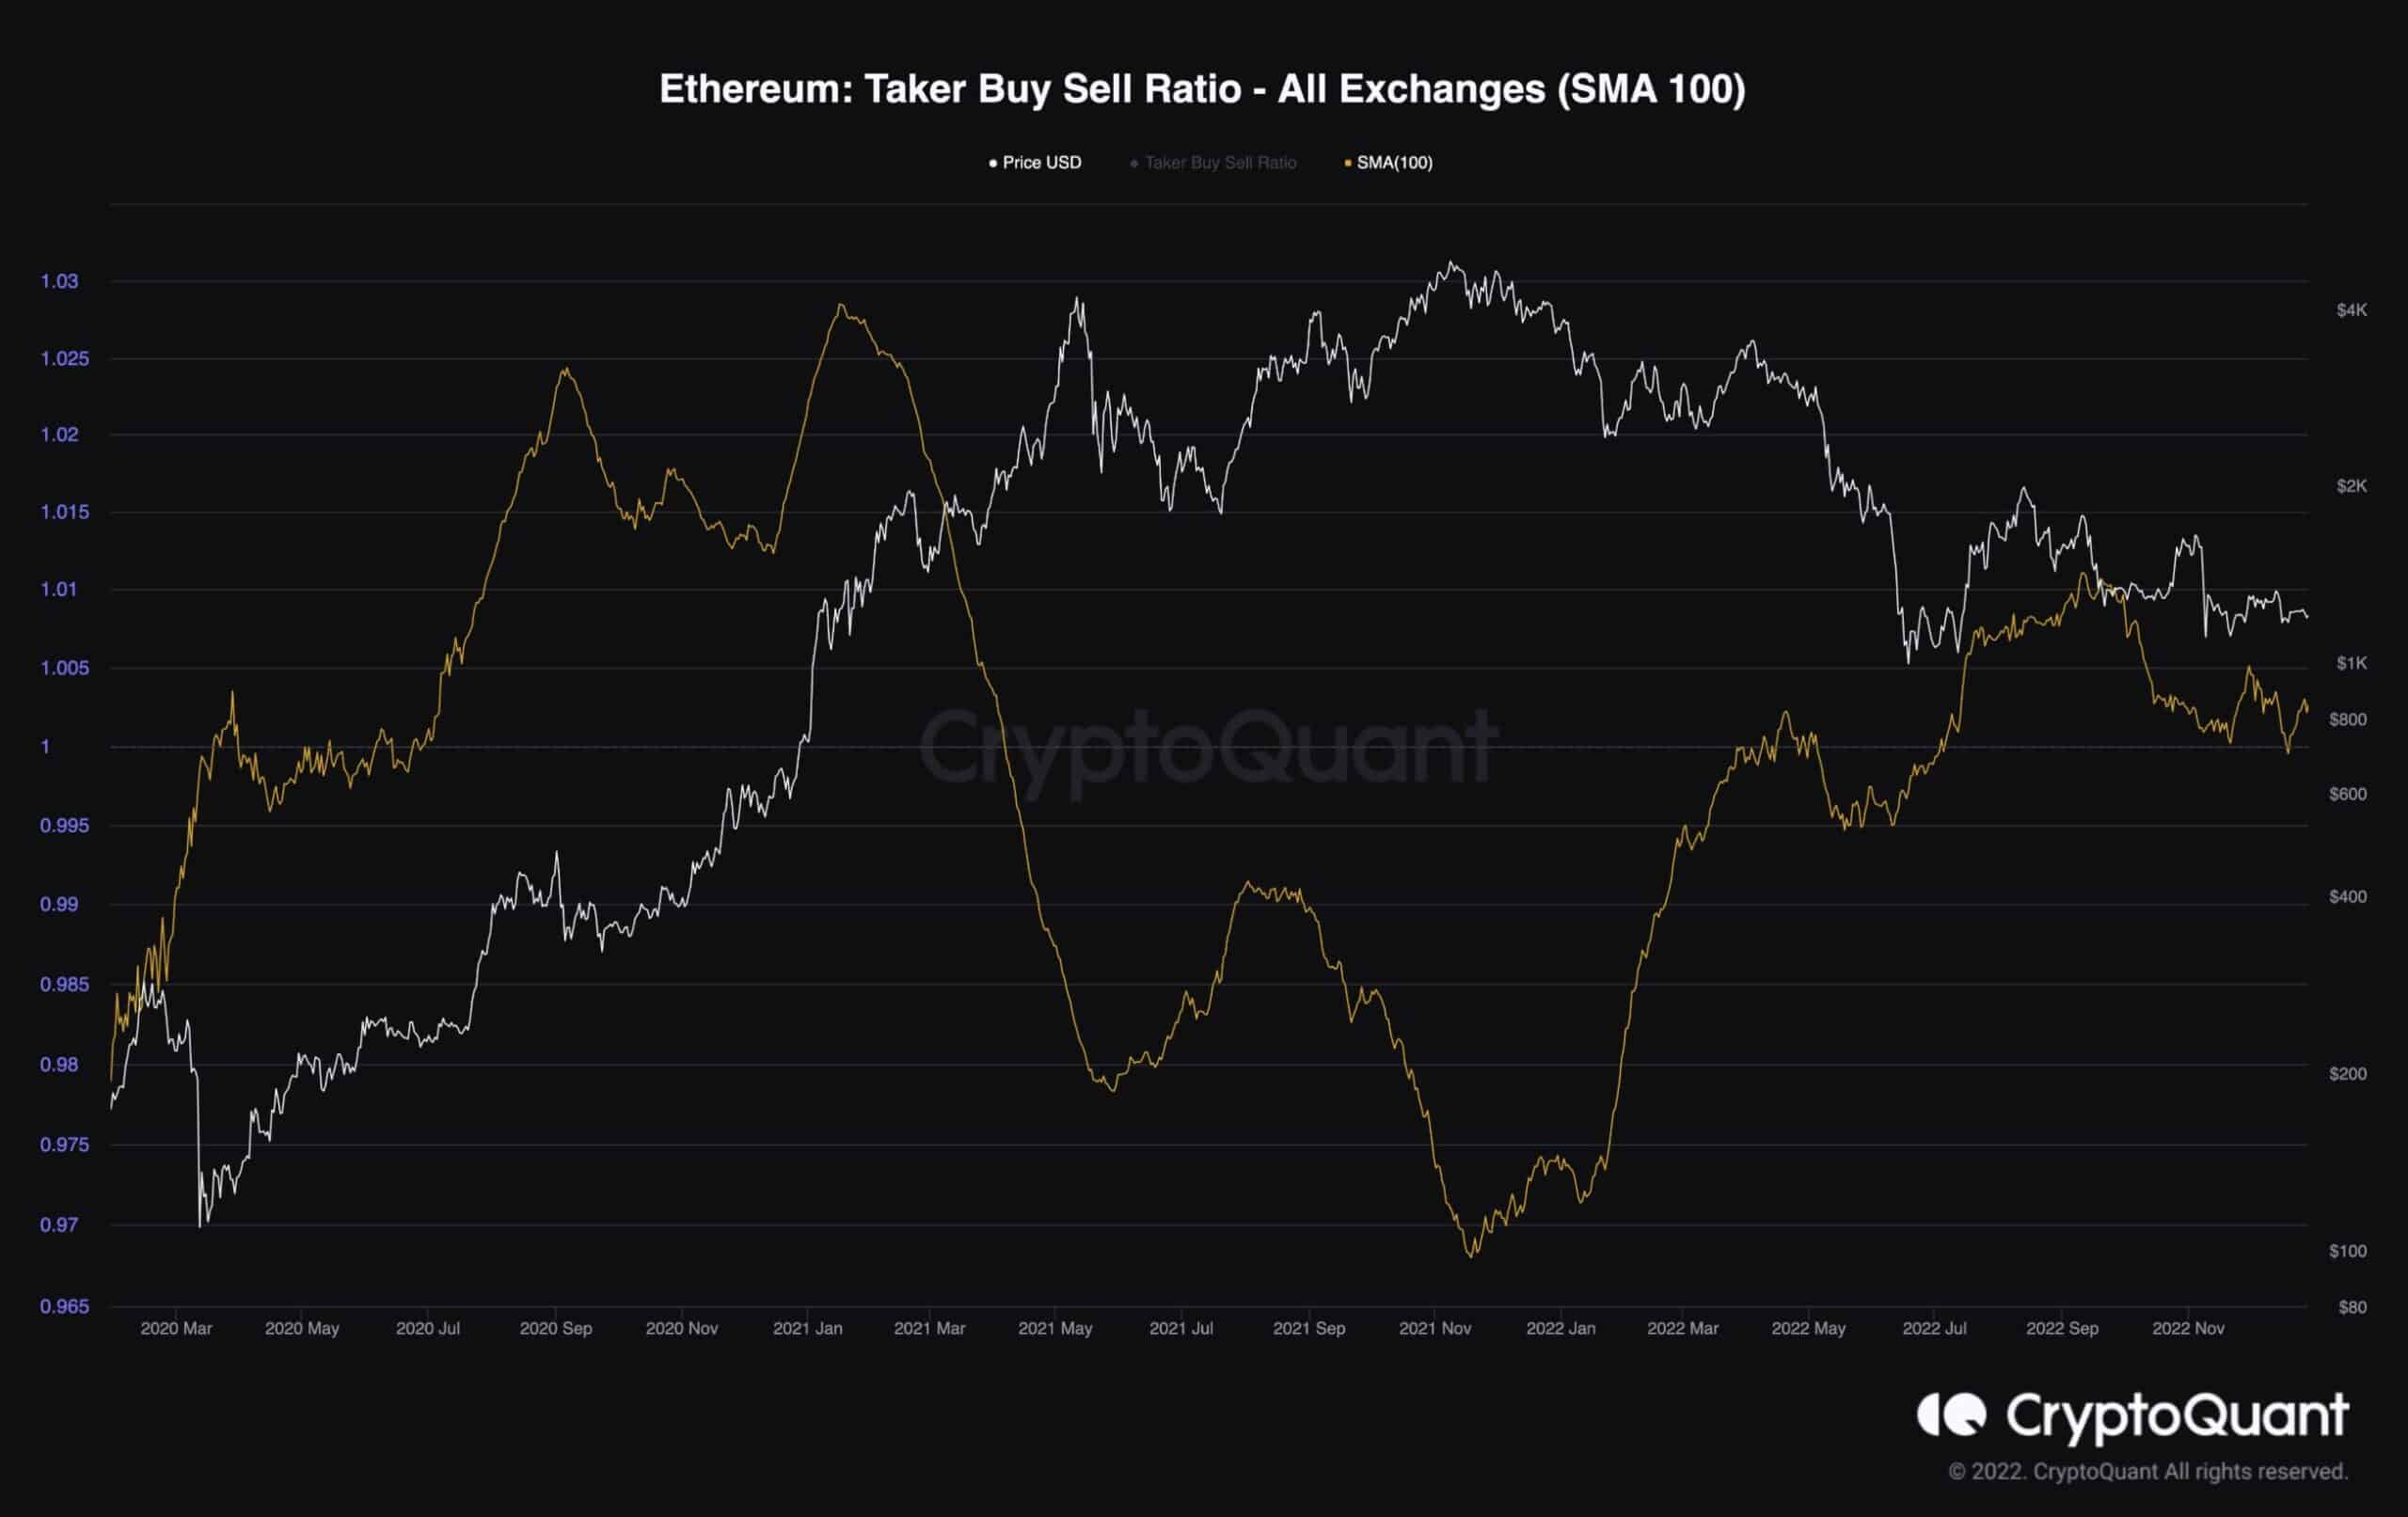
Ethereum Taker Buy Sell Ratio
Ethereum’s price is still reluctant to decline further and create a new lower low, and the futures market sentiment is highlighting one of the reasons for this relative strength.
This chart displays the 100-day moving average of the Taker Buy Sell Ratio, a metric predominantly used for assessing the futures market sentiment, as it indicates whether the bulls or bears are engaging more aggressively with their orders. Values above 1 show bullish sentiment, and conversely, values below 1 indicate the bears’ dominance. Moves above or below this threshold are also significant, as the metrics’ decline below 1 usually signals a crash in the short term.
This metric has been holding above 1 over the last few months, pointing to the bulls’ resilience in the futures market, as their orders create sufficient demand to prevent the price from dropping below the $1000 mark. If this behavior continues, even higher prices could be expected in the short term, as the price is seemingly forming a base however, if the metric drops below 1, a further continuation of the bear market would be highly probable.
Binance Free $100 (Exclusive): Use this link to register and receive $100 free and 10% off fees on Binance Futures first month (terms).
PrimeXBT Special Offer: Use this link to register & enter POTATO50 code to receive up to $7,000 on your deposits.
Disclaimer: Information found on CryptoPotato is those of writers quoted. It does not represent the opinions of CryptoPotato on whether to buy, sell, or hold any investments. You are advised to conduct your own research before making any investment decisions. Use provided information at your own risk. See Disclaimer for more information.
Cryptocurrency charts by TradingView.