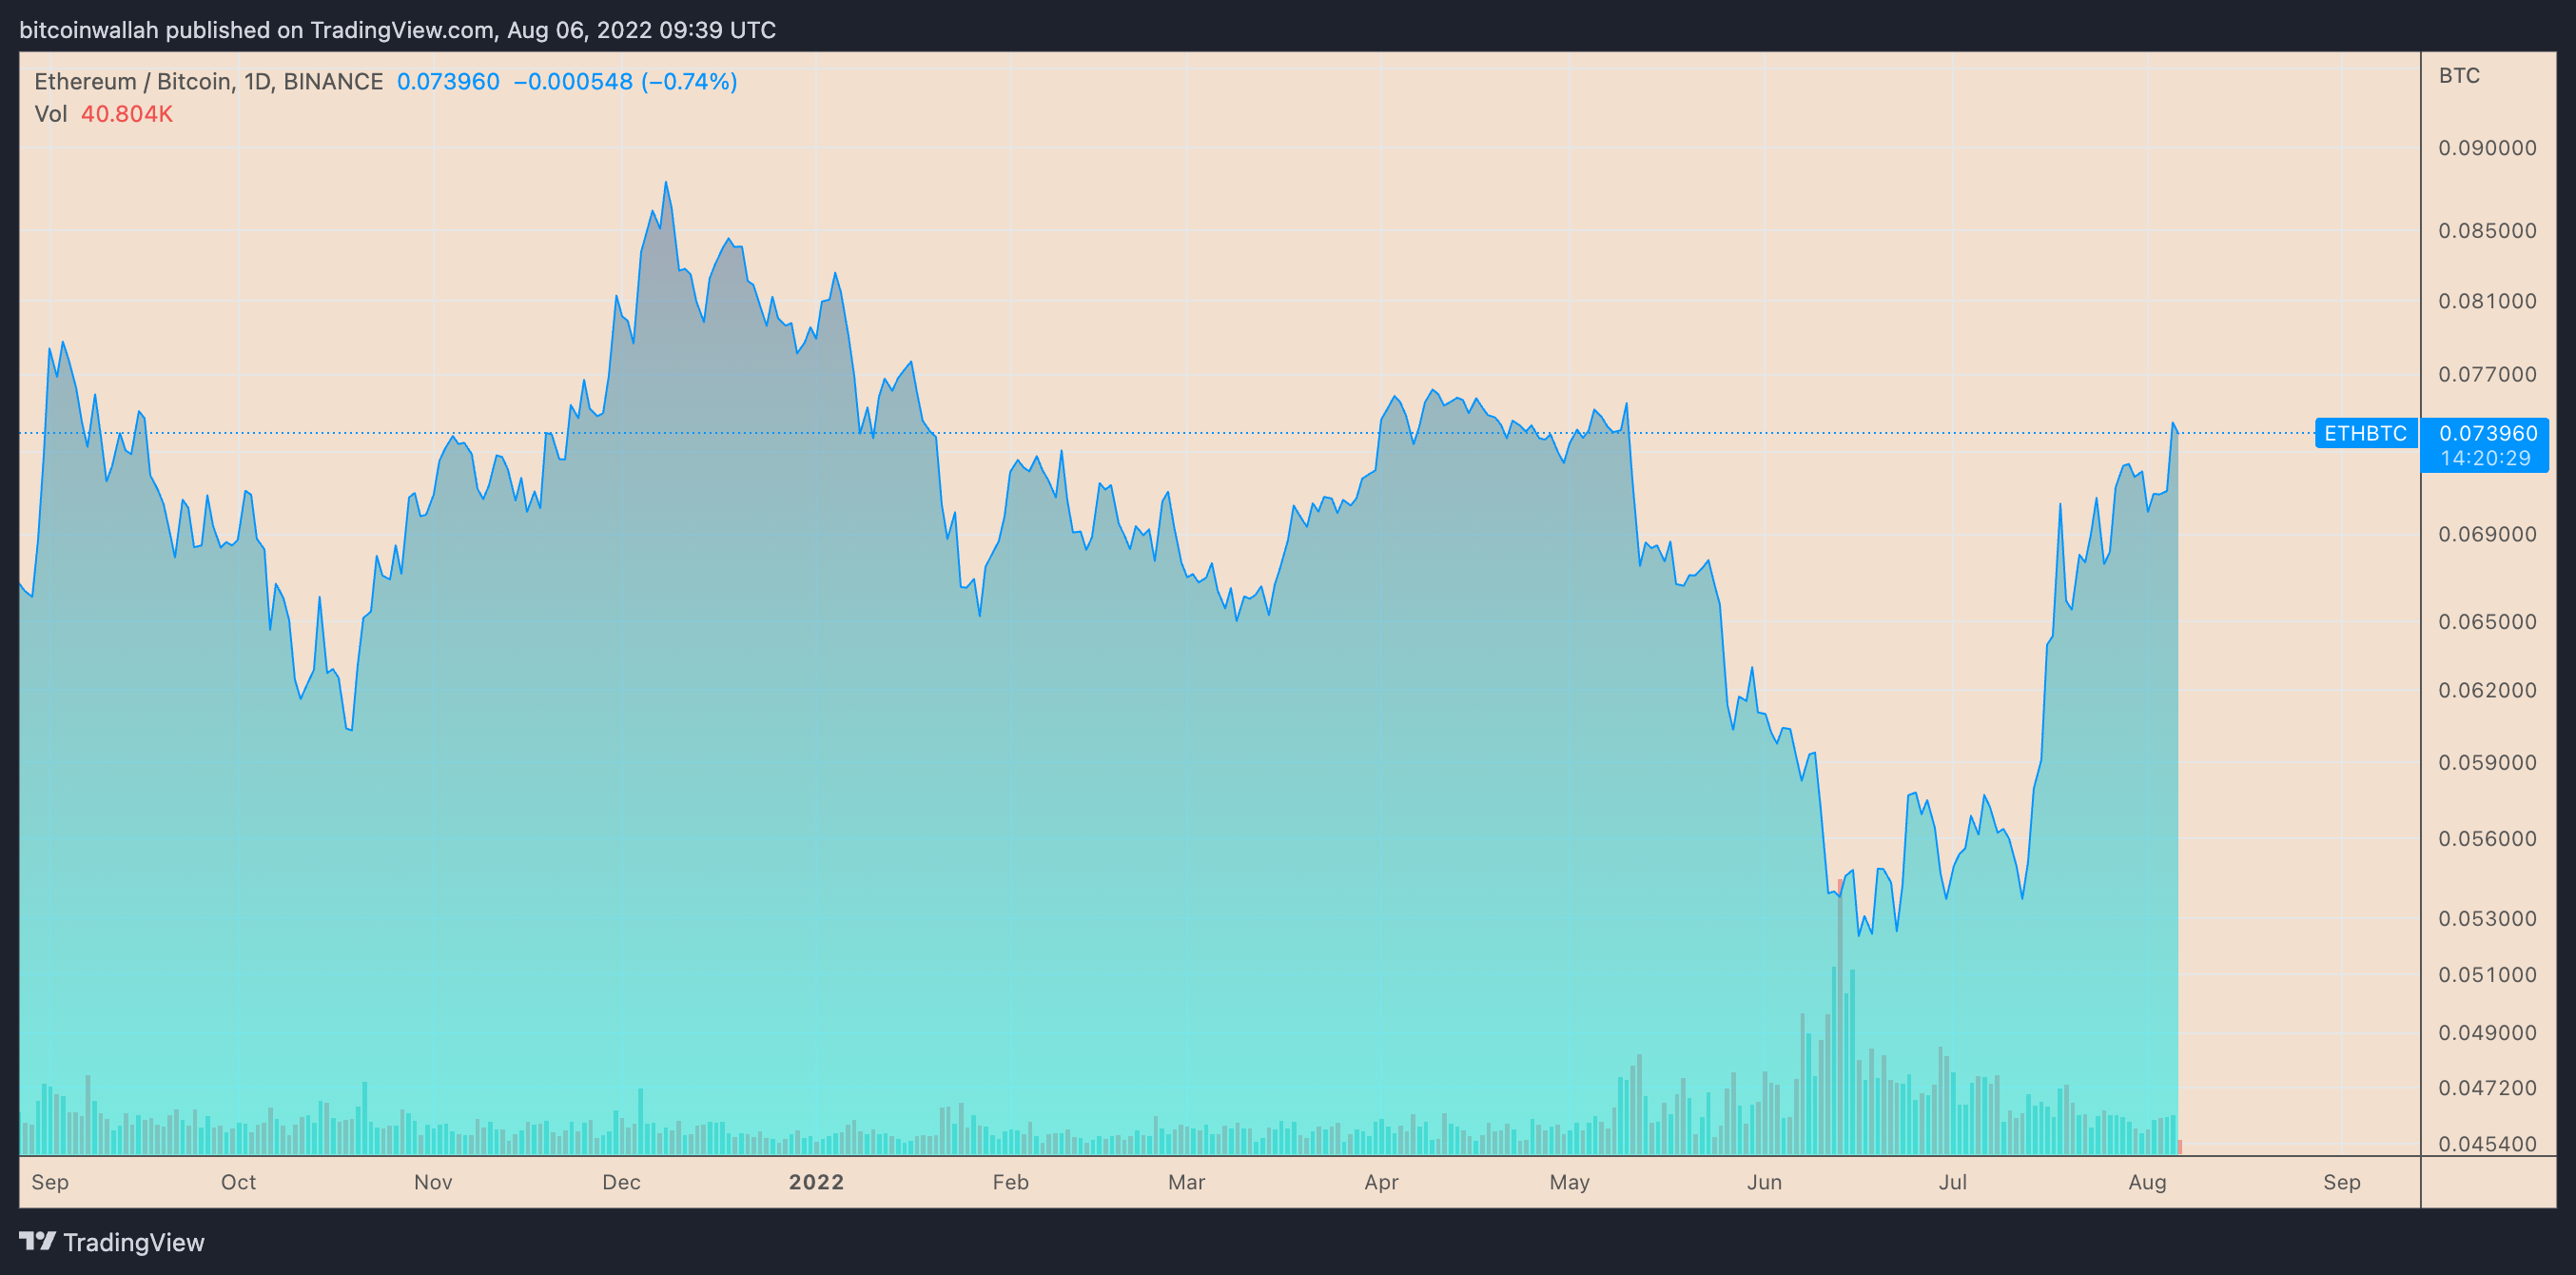
Ether (ETH), Ethereum’s native toke, has been continuing its uptrend against Bitcoin (BTC) as euphoria around its upcoming network upgrade, “the Merge,” grows.
ETH at multi-month highs against BTC
On the daily chart, ETH/BTC surged to an intraday high of 0.075 on Aug. 6, following a 1.5% upside move. Meanwhile, the pair’s gains came as a part of a broader rebound trend that started a month ago at 0.049, amounting to approximately 50% gains.
 ETH/BTC daily price chart. Source: TradingView
The ETH/BTC recovery in part has surfaced due to the Merge, which will have Ethereum switch from proof-of-work (PoW) mining to proof-of-stake (PoS).
Ethereum’s “rising wedge” suggests sell-off
From a technical perspective, Ether stares at potential interim losses as ETH/BTC paints a convincing rising wedge.
Rising wedges are bearish reversal patterns that occur when the price trends higher inside a range defined by two rising, converging trendlines. As a rule, they resolve after the price breaks below the lower trendline by as much as the structure’s maximum height.
 ETH/BTC daily price chart featuring “rising wedge” breakdown setup. Source: TradingView
Moreover, a declining volume and relative strength index (RSI) against a rising ETH/BTC further increases bearish divergence risks. This gives weight to the wedge’s bearish setup for a target of 0.064 BTC, or down 11% from today’s price.
Ether looks stronger vs. dollar
Meanwhile, technicals paint a brighter picture for Ethereum against the U.S. dollar. The potential of a 10% breakout for ETH/USD looks strong in August due to a classic bullish reversal pattern.
Related: Decentralized finance faces multiple barriers to mainstream adoption
On a four-hour chart, ETH/USD has formed what appears to be a “double bottom.” This pattern resembles the letter “W” due to two consecutive lows followed by a change in direction from downtrend to uptrend, as illustrated below.
 ETH/USD four-hour price chart featuring “double bottom” breakout setup. Source: TradingView
Meanwhile, a double bottom pattern resolves after the price breaks above its common resistance level and-as a rule of technical analysis-rises by as much as the distance between the first bottom and the resistance.
As a result, ETH could rally toward $1,940 in August, up 10% from today’s price.
The views and opinions expressed here are solely those of the author and do not necessarily reflect the views of Cointelegraph.com. Every investment and trading move involves risk, you should conduct your own research when making a decision.


