Bitcoin (BTC) meandered into the weekly close on July 3 after weekend trading produced a brief wick below $18,800.
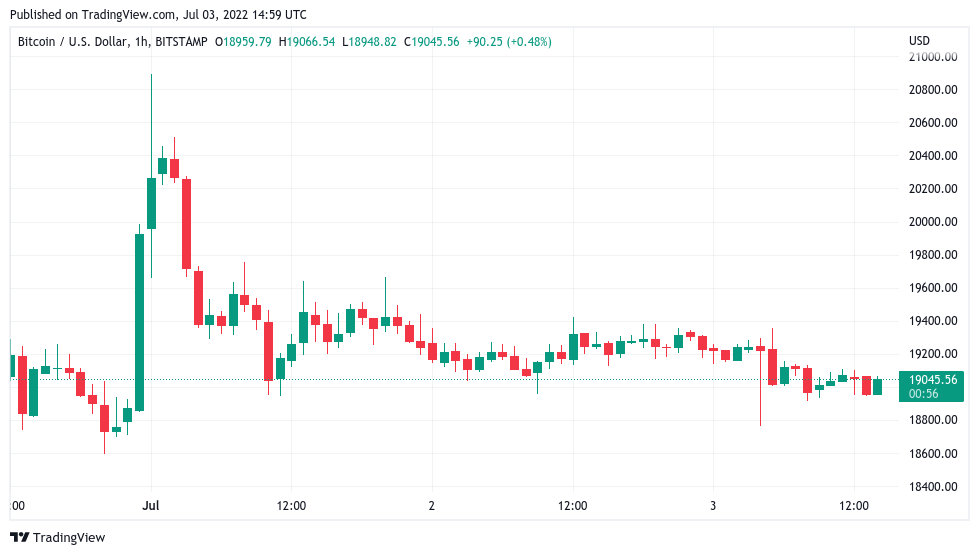 BTC/USD 1-hour candle chart (Bitstamp). Source: TradingView
Bollinger bands signal volatility due
Data from Cointelegraph Markets Pro and TradingView followed BTC/USD as it stuck to $19,000 rigidly for a third day running.
The pair had gone light on volatility overall at the weekend, but at the time of writing was still on track for the first weekly close below its prior halving cycle’s all-time high since December 2020.
The previous weekend’s action had produced a late surge which saved bulls from a close below $20,000.
Momentum remained weak throughout the following week’s Wall Street trading, however, and traders were unconvinced about the potential for a significant relief bounce.
“Looking for a push down to the lower support zone at $18,000 while we are below $19,300. Quick scalp and tight invalidation,” popular Twitter account Crypto Tony wrote in an update to followers on the day.
“I can’t really trust this move because it’s ‘weekend pa,'” fellow account Ninja continued in part of a further post, adding that “if bulls can’t push to $19.7k, I don’t think the dump is over.”
Up or down, incoming volatility was being keenly eyed by commentators as the weekly close drew near. Popular analyst Matthew Hyland noted that the Bollinger bands indicator was signaling that price conditions would soon become more erratic.
#Bitcoin Bollinger Bands tightening on the daily time frame as displayed on the width indicator: pic.twitter.com/c0bqmMfdSi
– Matthew Hyland (@MatthewHyland_) July 3, 2022
On daily timeframes, BTC/USD traded near the bottom Bollinger band, threatening a drop below as an expression of volatility similar to that which occurred in May.
 BTC/USD 1-day candle chart (Bitstamp) with Bollinger bands. Source: TradingView
Underwater addresses surpass March 2020 peak
Fresh data meanwhile showed just how much pain the average hodler was going through after the worst monthly losses since 2011.
Related: Bitcoin indicator that nailed all bottoms predicts $15.6K BTC price floor
According to on-chain monitoring firm Glassnode, the weekly moving average number of unique BTC addresses now at a loss reached a new all-time high of 18.8 million on July 3.
As Cointelegraph previously reported, in previous capitulation events, 60% of the supply needed to see unrealized losses.
 Bitcoin addresses in loss chart. Source: Glassnode
“Almost $40 Billion in Bitcoin Net Realized Losses since May 1st,” analytics account On-Chain College summarized as June came to a close:
“Some have quit, some have stuck around. One thing is for sure- if you’ve been in this space over the last year and you’re still here, you’ve been through quite a lot of volatility.”
The views and opinions expressed here are solely those of the author and do not necessarily reflect the views of Cointelegraph.com. Every investment and trading move involves risk, you should conduct your own research when making a decision.