Ethereum’s native token Ether (ETH) tumbled to its worst levels in almost two months against the U.S. dollar on May 6 as the rout in financial markets rippled across the cryptocurrency sector. Nonetheless, ETH did fare better than Bitcoin (BTC) with the ETH/BTC pair hitting a three week high.
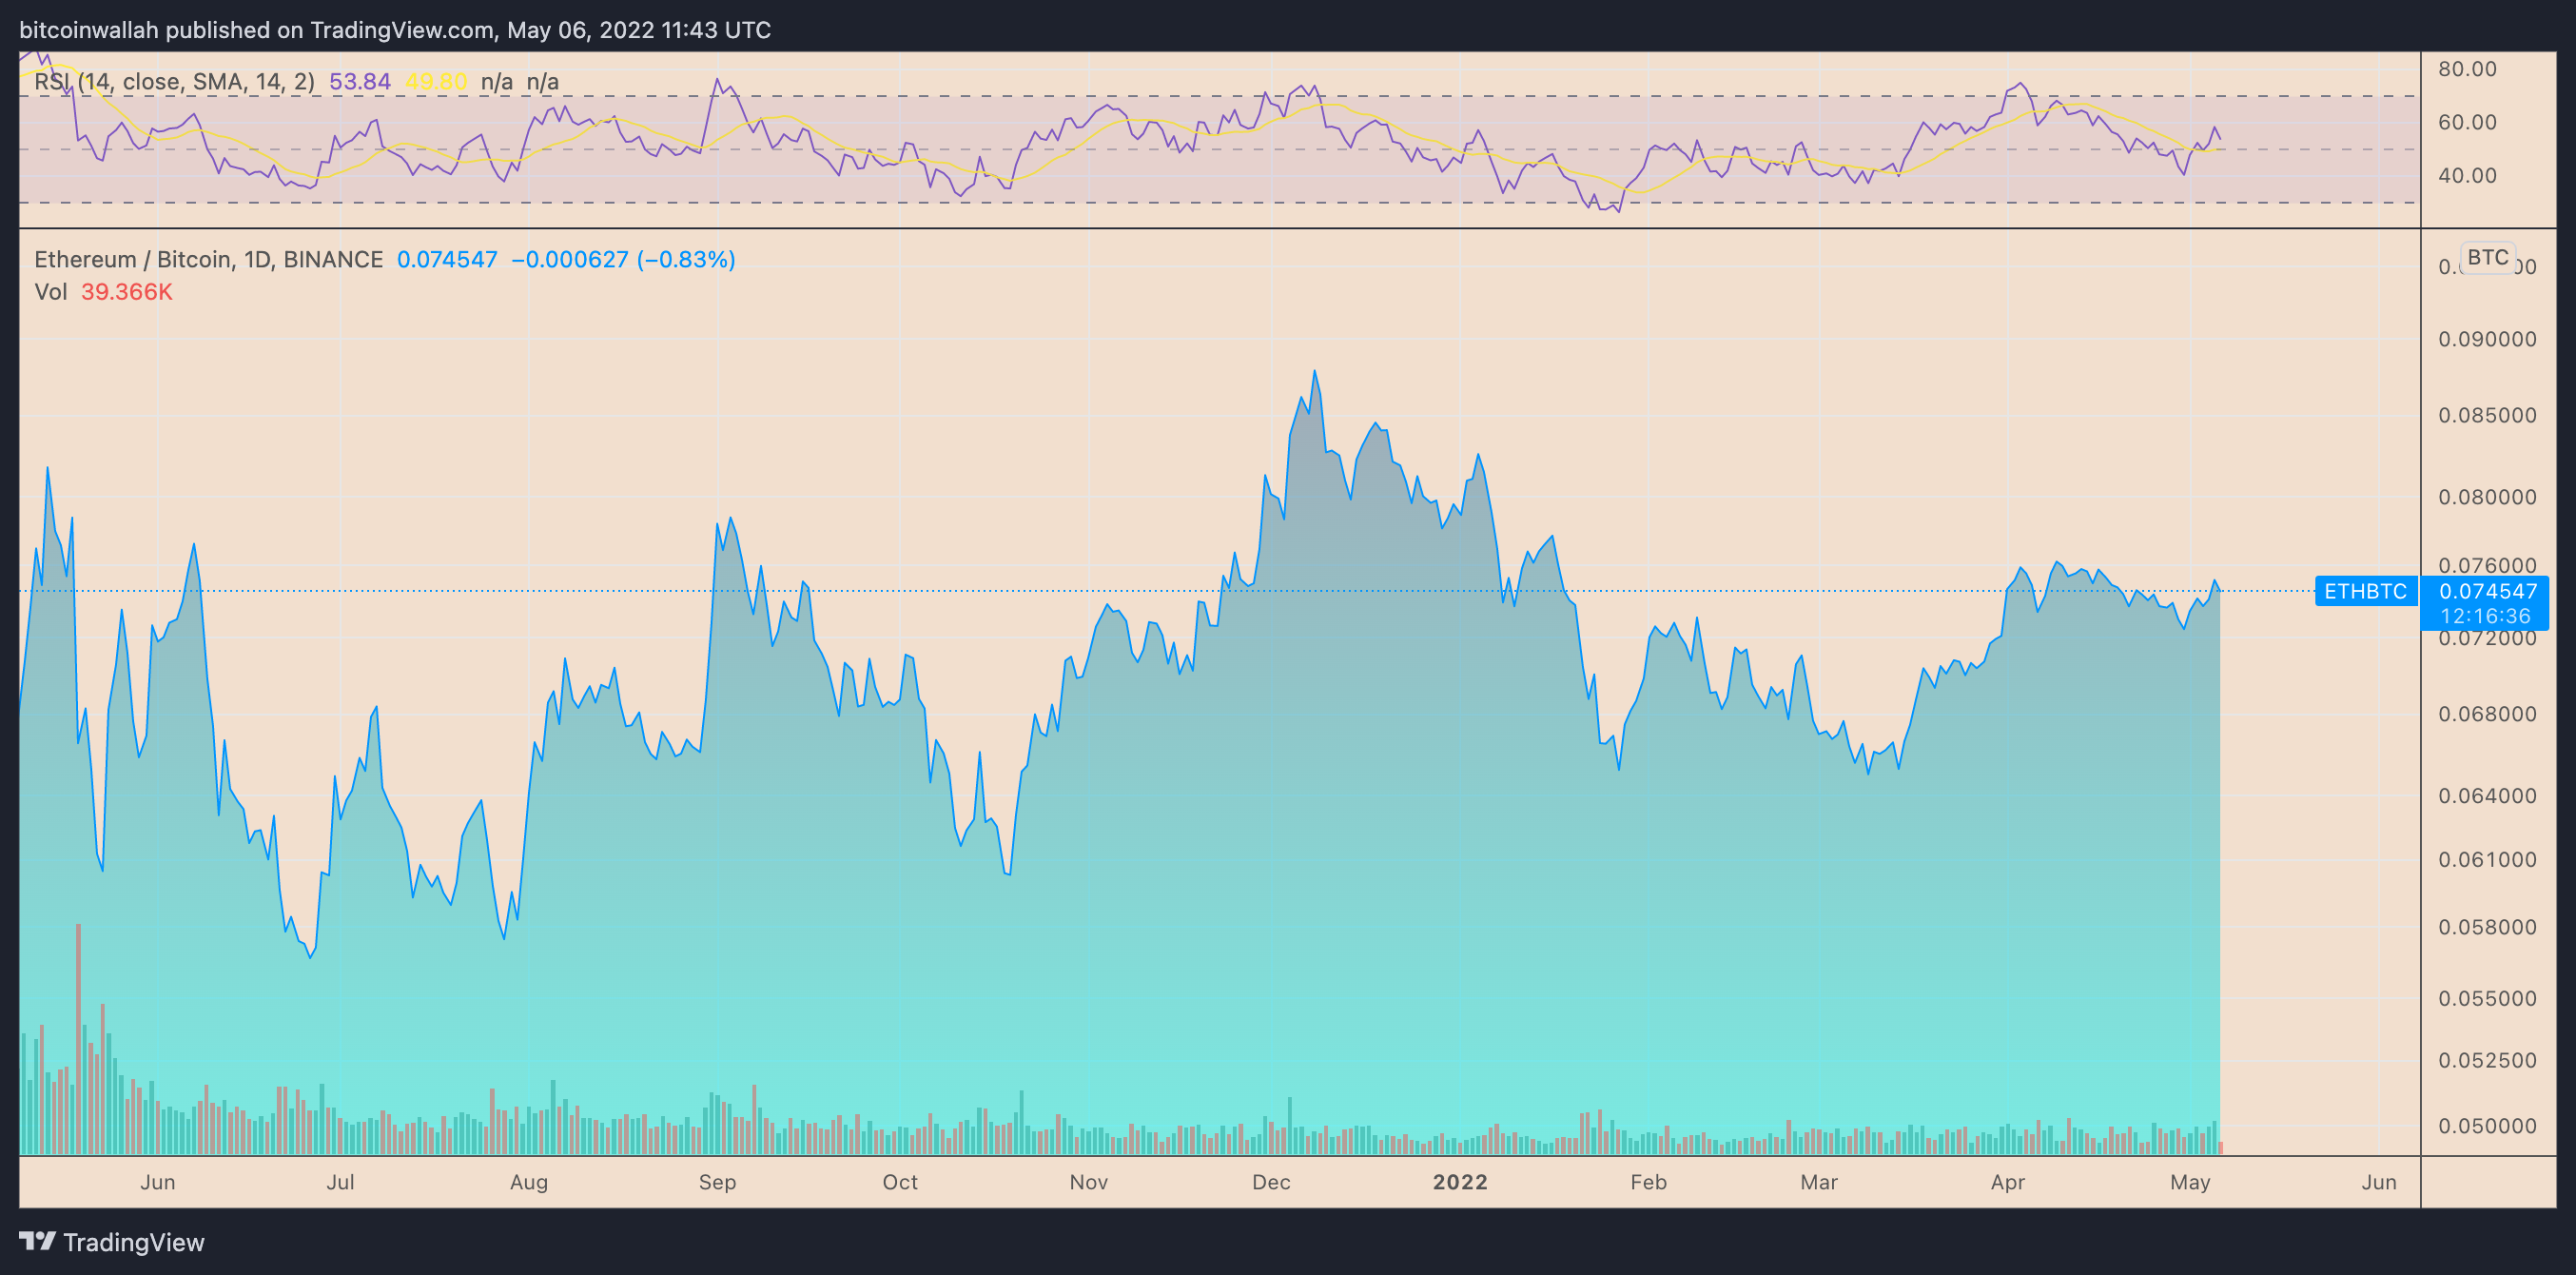 ETH/BTC daily price chart. Source: TradingView
The Merge impact
Many analysts credited Ethereum’s merge to proof-of-stake from proof-of-work as one of the key reasons behind the capital rotation from Ether to Bitcoin markets, including Toast.ETH, a pseudonymous analyst, who underscored Ether’s ongoing supply reduction as another reason ETH may be currently outperforming BTC.
Interestingly, Ethereum has grown by nearly 250% against Bitcoin since the beginning of its migration to proof-of-stake in December 2020.
 ETH/BTC weekly price chart. Source: TradingView
Eliezer Ndinga, a research lead at 21 Shares, a Zug-based crypto ETP provider, pointed out that “liquid staking” could also be playing a big role in reducing sell-side pressure.
Liquid staking is the main cushion here, hence why Lido is the largest DeFi app by TVL – up 51% YTD from $11.9B to over $18B
As of writing, Lido is the second largest app by TVL actually. Still an incredible ride. https://t.co/9HgBsu2PC6
– Ξli (hiring!) (@elindinga) May 5, 2022
ETH/BTC upside prospects
Technicals indicate ETH/BTC could grow further in May but risks a broader correction overall as its trends inside a rising wedge pattern.
The pair has bounced after testing the wedge’s lower trendline as support on April 30, and is now heading towards the upper trendline (around 0.078) as its interim upside target.
Related: Bitcoin’s rocky road to becoming a risk-off asset: Analysts investigate
But since rising wedges are typically bearish reversal patterns ETH/BTC’s likelihood of breaking lower remains higher in the long-term.
 ETH/BTC daily price chart featuring ‘rising wedge’ setup. Source: TradingView
As a rule of technical analysis, rising wedge breakdowns end up with the price crashing to level at a length equal to the pattern’s maximum height when measured from the breakdown point, i.e. 0.064-0.069.
ETH/USD bearish scenario
Technical signals suggest more downside prospects for Ether in the coming months, with a “bear flag” pattern projecting ETH’s price decline toward $1,700 in Q2, down about 40% from today’s price.
 ETH/USD weekly price chart featuring ‘bear flag’ setup. Source: TradingView
Conversely, a rebound from the flag’s lower trendline could have Ether retest $4,000.
The views and opinions expressed here are solely those of the author and do not necessarily reflect the views of Cointelegraph.com. Every investment and trading move involves risk, you should conduct your own research when making a decision.