XRP pricewas wobbling between profits and losses on Sep. 19 despite hopes that Ripple would eventually win its long-running legal battle against the U.S. Securities and Exchange Commission (SEC).
Ripple and the SEC both agreed to expedite the lawsuit on Friday to get an answer on whether $XRP is a security or not.
From the updates of the case, it sounds like it’s in the favor of @Ripple pic.twitter.com/SAyl4VLxdM
– Jeff Sekinger (@JeffSekinger) September 19, 2022
Fed spoils SEC vs. Ripple euphoria
The XRP/USD pair dropped by over 1% to $0.35 while forming extremely sharp bullish and bearish wicks on its Sep. 19 daily candlestick. In other words, its intraday performance hinted at a growing bias conflict among traders.
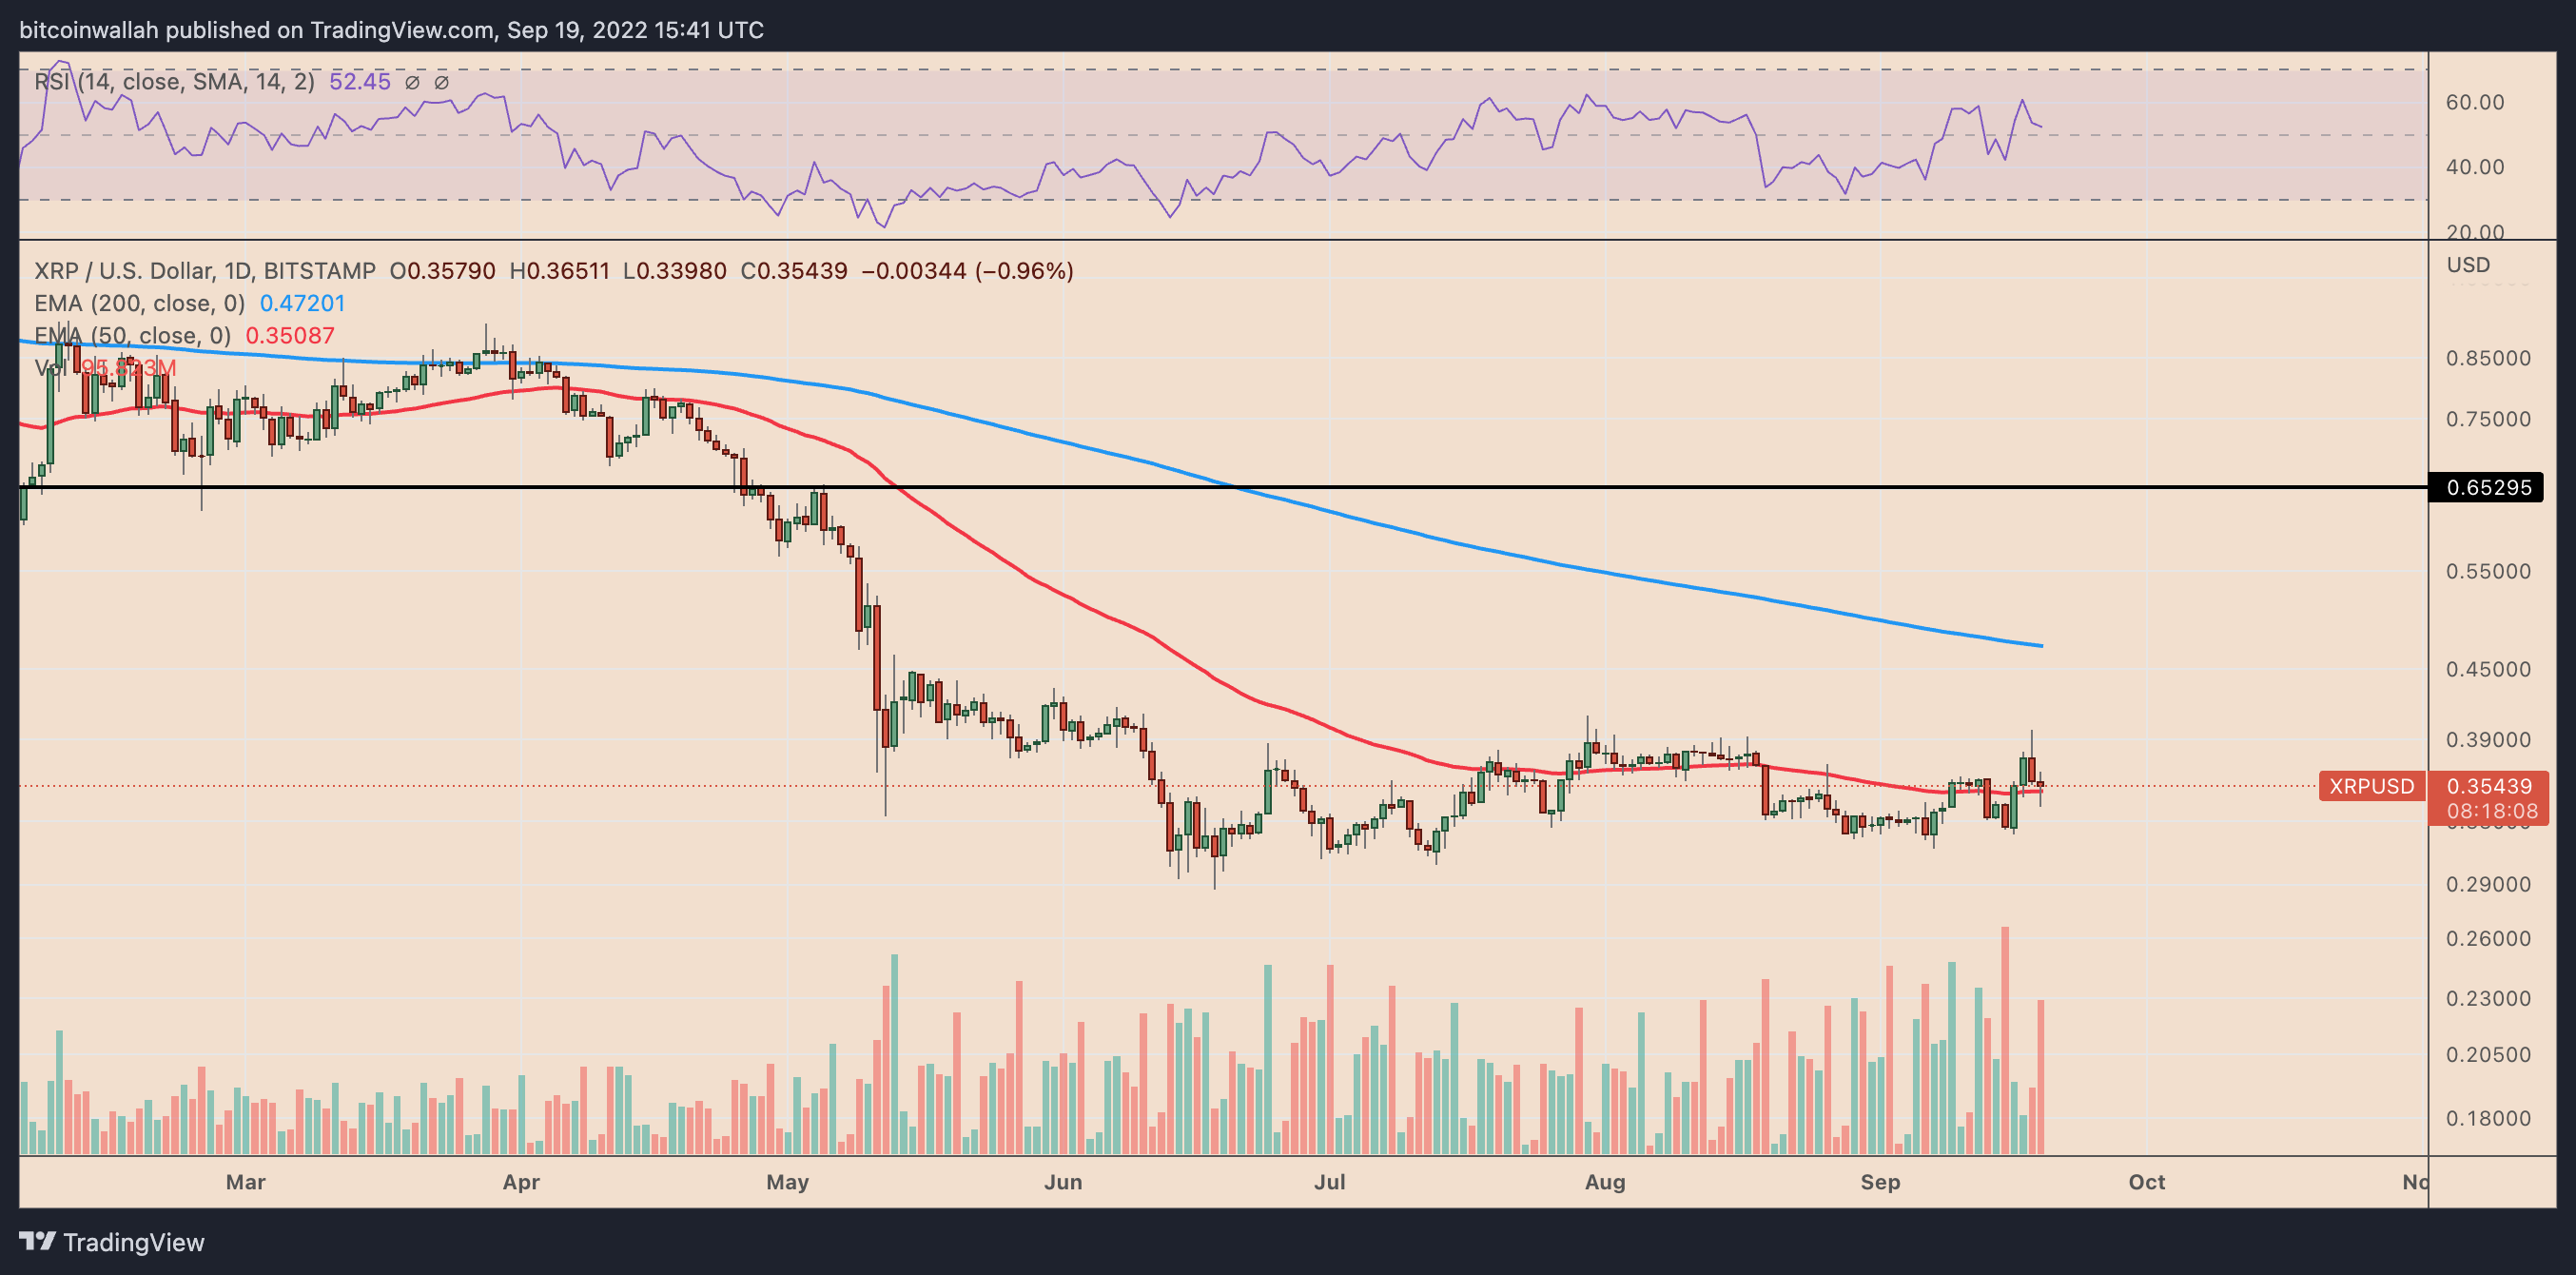 XRP/USD daily price chart. Source: TradingView
The indecisiveness could be due to XRP’s exposure to catalysts other than the SEC vs. Ripple lawsuit. Namely, the Federal Reserve’s potential to increase its benchmark interest rates by another 75 or 100 basis points in their policy meeting on Sep. 20.
As Cointelegraph reported, fears of aggressive rate hikes have pressured the crypto market lower throughout the year, including Bitcoin (BTC) and Ether (ETH). XRP is also not immune, given the token’s consistently positive correlation with Bitcoin since October 2021.
 XRP/USD and BTC/USD daily correlation coefficient. Source: TradingView
For instance, XRP’s daily correlation coefficient with Bitcoin on Sep. 19 was 0.47. A reading of 1 means that the two assets move in lockstep.
XRP price in danger of going under $0.25 in Q4
Independent market analyst Cheds highlighted that XRP has been fluctuating inside a rectangular range since June, adding that “there’s nothing to be excited about” at present.
The range is defined by $0.38-$0.40 acting as resistance and $0.28-$0.30 acting as support. XRP’s price dropped after testing the resistance and, as of Sep. 19, was heading toward the support area, as shown below.
 XRP/USD daily price chart featuring head-and-shoulders setup. Source: TradingView
Interestingly, a move toward the rectangular range support could also trigger a classic bearish reversal pattern called the head-and-shoulders, defined by three consecutive peaks forming atop a common support level, with the middle peak (head) higher than the other two (left and right shoulders).
Related: Ether staking could trigger securities laws – Gensler
A head-and-shoulders pattern resolves after the price breaks below its support line and falls by as much as the maximum distance between the middle peak and the support. Applying this theory to XRP’s daily chart presents $0.242 as the downside target.
In other words, XRP price could lose another 30% by the end of this year, driven primarily by macro catalysts.
The views and opinions expressed here are solely those of the author and do not necessarily reflect the views of Cointelegraph.com. Every investment and trading move involves risk, you should conduct your own research when making a decision.