At least two technical indicators show Solana (SOL) could undergo a sharp price recovery in June, even after the SOL/USD pair’s 78.5% year-to-date decline.
SOL price nears bullish wedge breakout
First, Solana has been painting a “falling wedge” since May, confirmed by its fluctuations inside two descending, converging trendlines. Traditional analysts consider falling wedges as bullish reversal patterns, meaning they resolve after the price breaks above their upper trendlines.
As a rule of technical analysis, a falling wedge’s profit target is measured after adding the maximum distance between its upper and lower trendlines to the breakout point. So depending on SOL’s breakout level, its price would rise by roughly $20, as shown below.
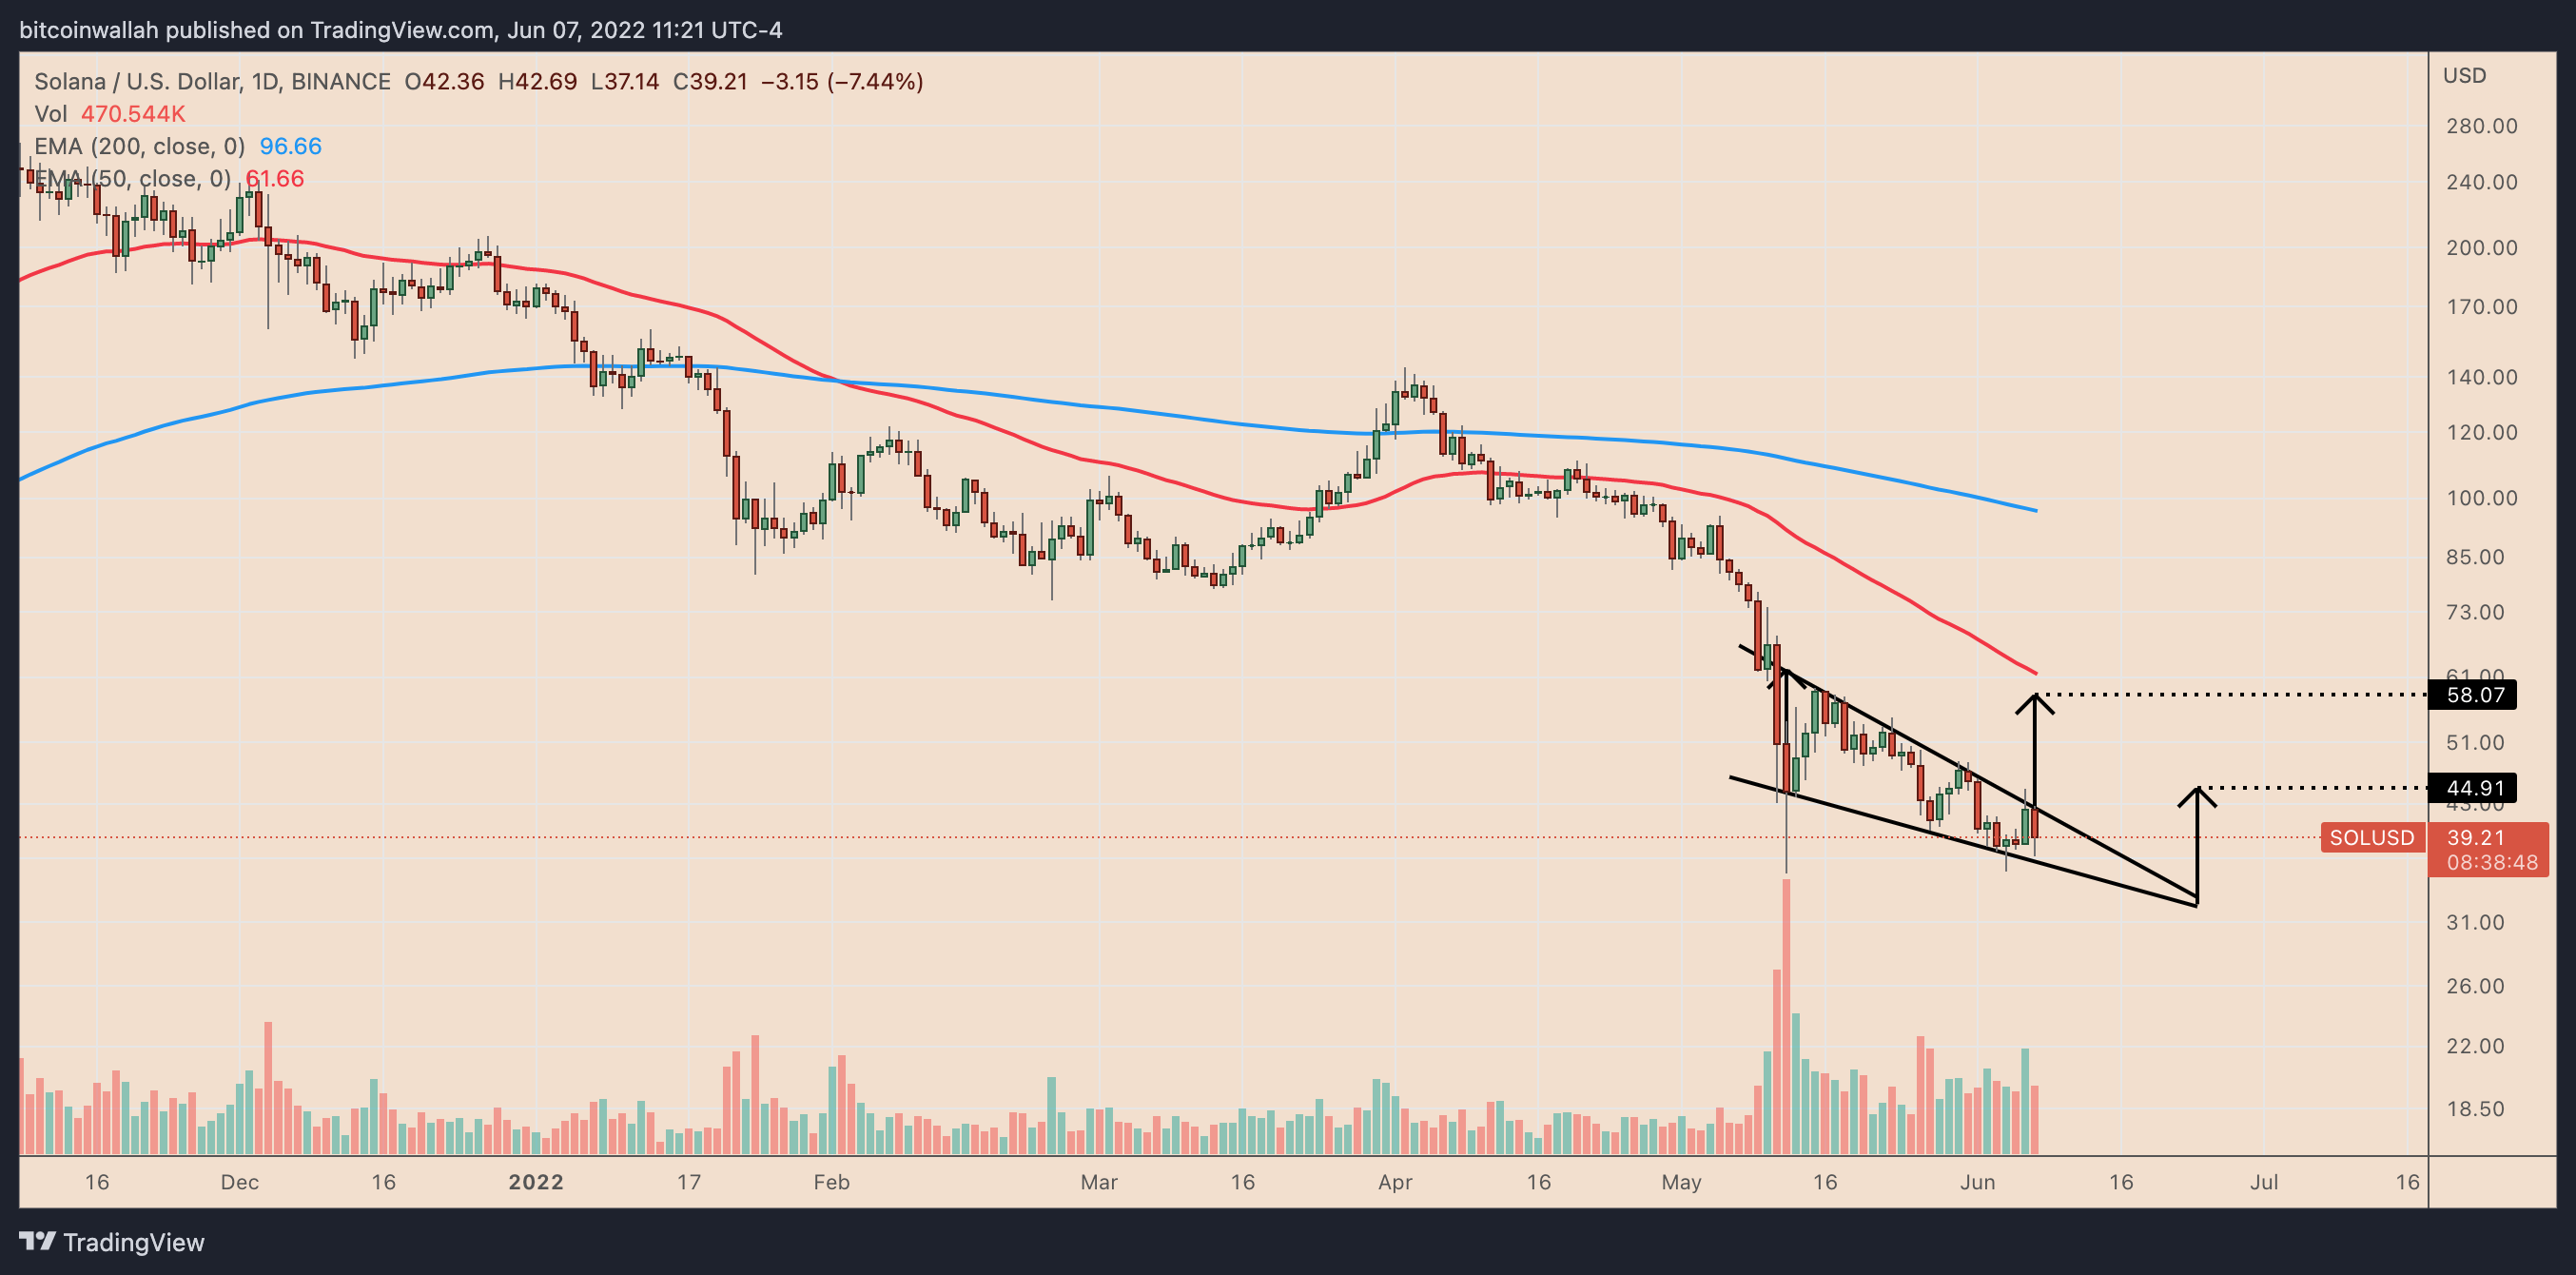 SOL/USD daily price chart featuring “rising wedge” breakout setup. Source: TradingView
That puts the SOL’s price target at $58 if measured from the current price, or about 35% higher. But if the price retreats after testing the wedge’s upper trendline and continues to fluctuate inside its range, SOL’s profit target would keep getting lower.
The Solana token can rise at least to $44 after breaking out of its wedge pattern.
Bullish divergence
More upside cues for Solana come from a growing separation between its price and momentum trends.
In detail, SOL’s recent downside moves accompany an upside retracement in the readings of its daily relative price index (RSI), a momentum oscillator that detects an asset’s overbought (>70) and oversold (<30) conditions.
 SOL/USD daily price chart featuring price-momentum divergence. Source: TradingView
This situation, otherwise known as “bullish divergence,” shows that bears are losing control and that bulls would capture the market again.
Solana still faces bearish risks
Financial market veteran Tom Bulkowski believes falling wedges are poor bullish indicators, however, with a higher breakeven failure rate of 26%. Meanwhile, there is only a 64% chance that a falling wedge would meet its profit target, which leaves Solana with the possibility of continuing its downtrend.
Related: Solana developers tackle bugs hoping to prevent further outages
Bulkowski asserts:
“The only variation that works well is a downward breakout in a bear market.”
Fundamentals around Solana agree with a downside outlook. They include a hawkish Federal Reserve and the negative impact of their tightening on riskier assets, including cryptos and equities.
As a result, SOL could move lower under the said macro risks, with its next potential downside target in the $19-$25 area, as shown below.
 SOL/USD weekly price chart. Source: TradingView
This range was instrumental as support in the March-July 2021 session.
The views and opinions expressed here are solely those of the author and do not necessarily reflect the views of Cointelegraph.com. Every investment and trading move involves risk, you should conduct your own research when making a decision.