Ether’s (ETH) rally versus Bitcoin (BTC) is not only showing signs of exhaustion, but is also in danger of breaking below a key technical support level.
ETH slides vs. BTC in second half of January
The ETH/BTC pair declined nearly 9.25% on Jan. 24 from its local top of 0.0779 BTC established on Jan. 11. Since the start of the year, Bitcoin is slightly outpacing Ether in USD terms, rising 38% versus 35%, respectively.
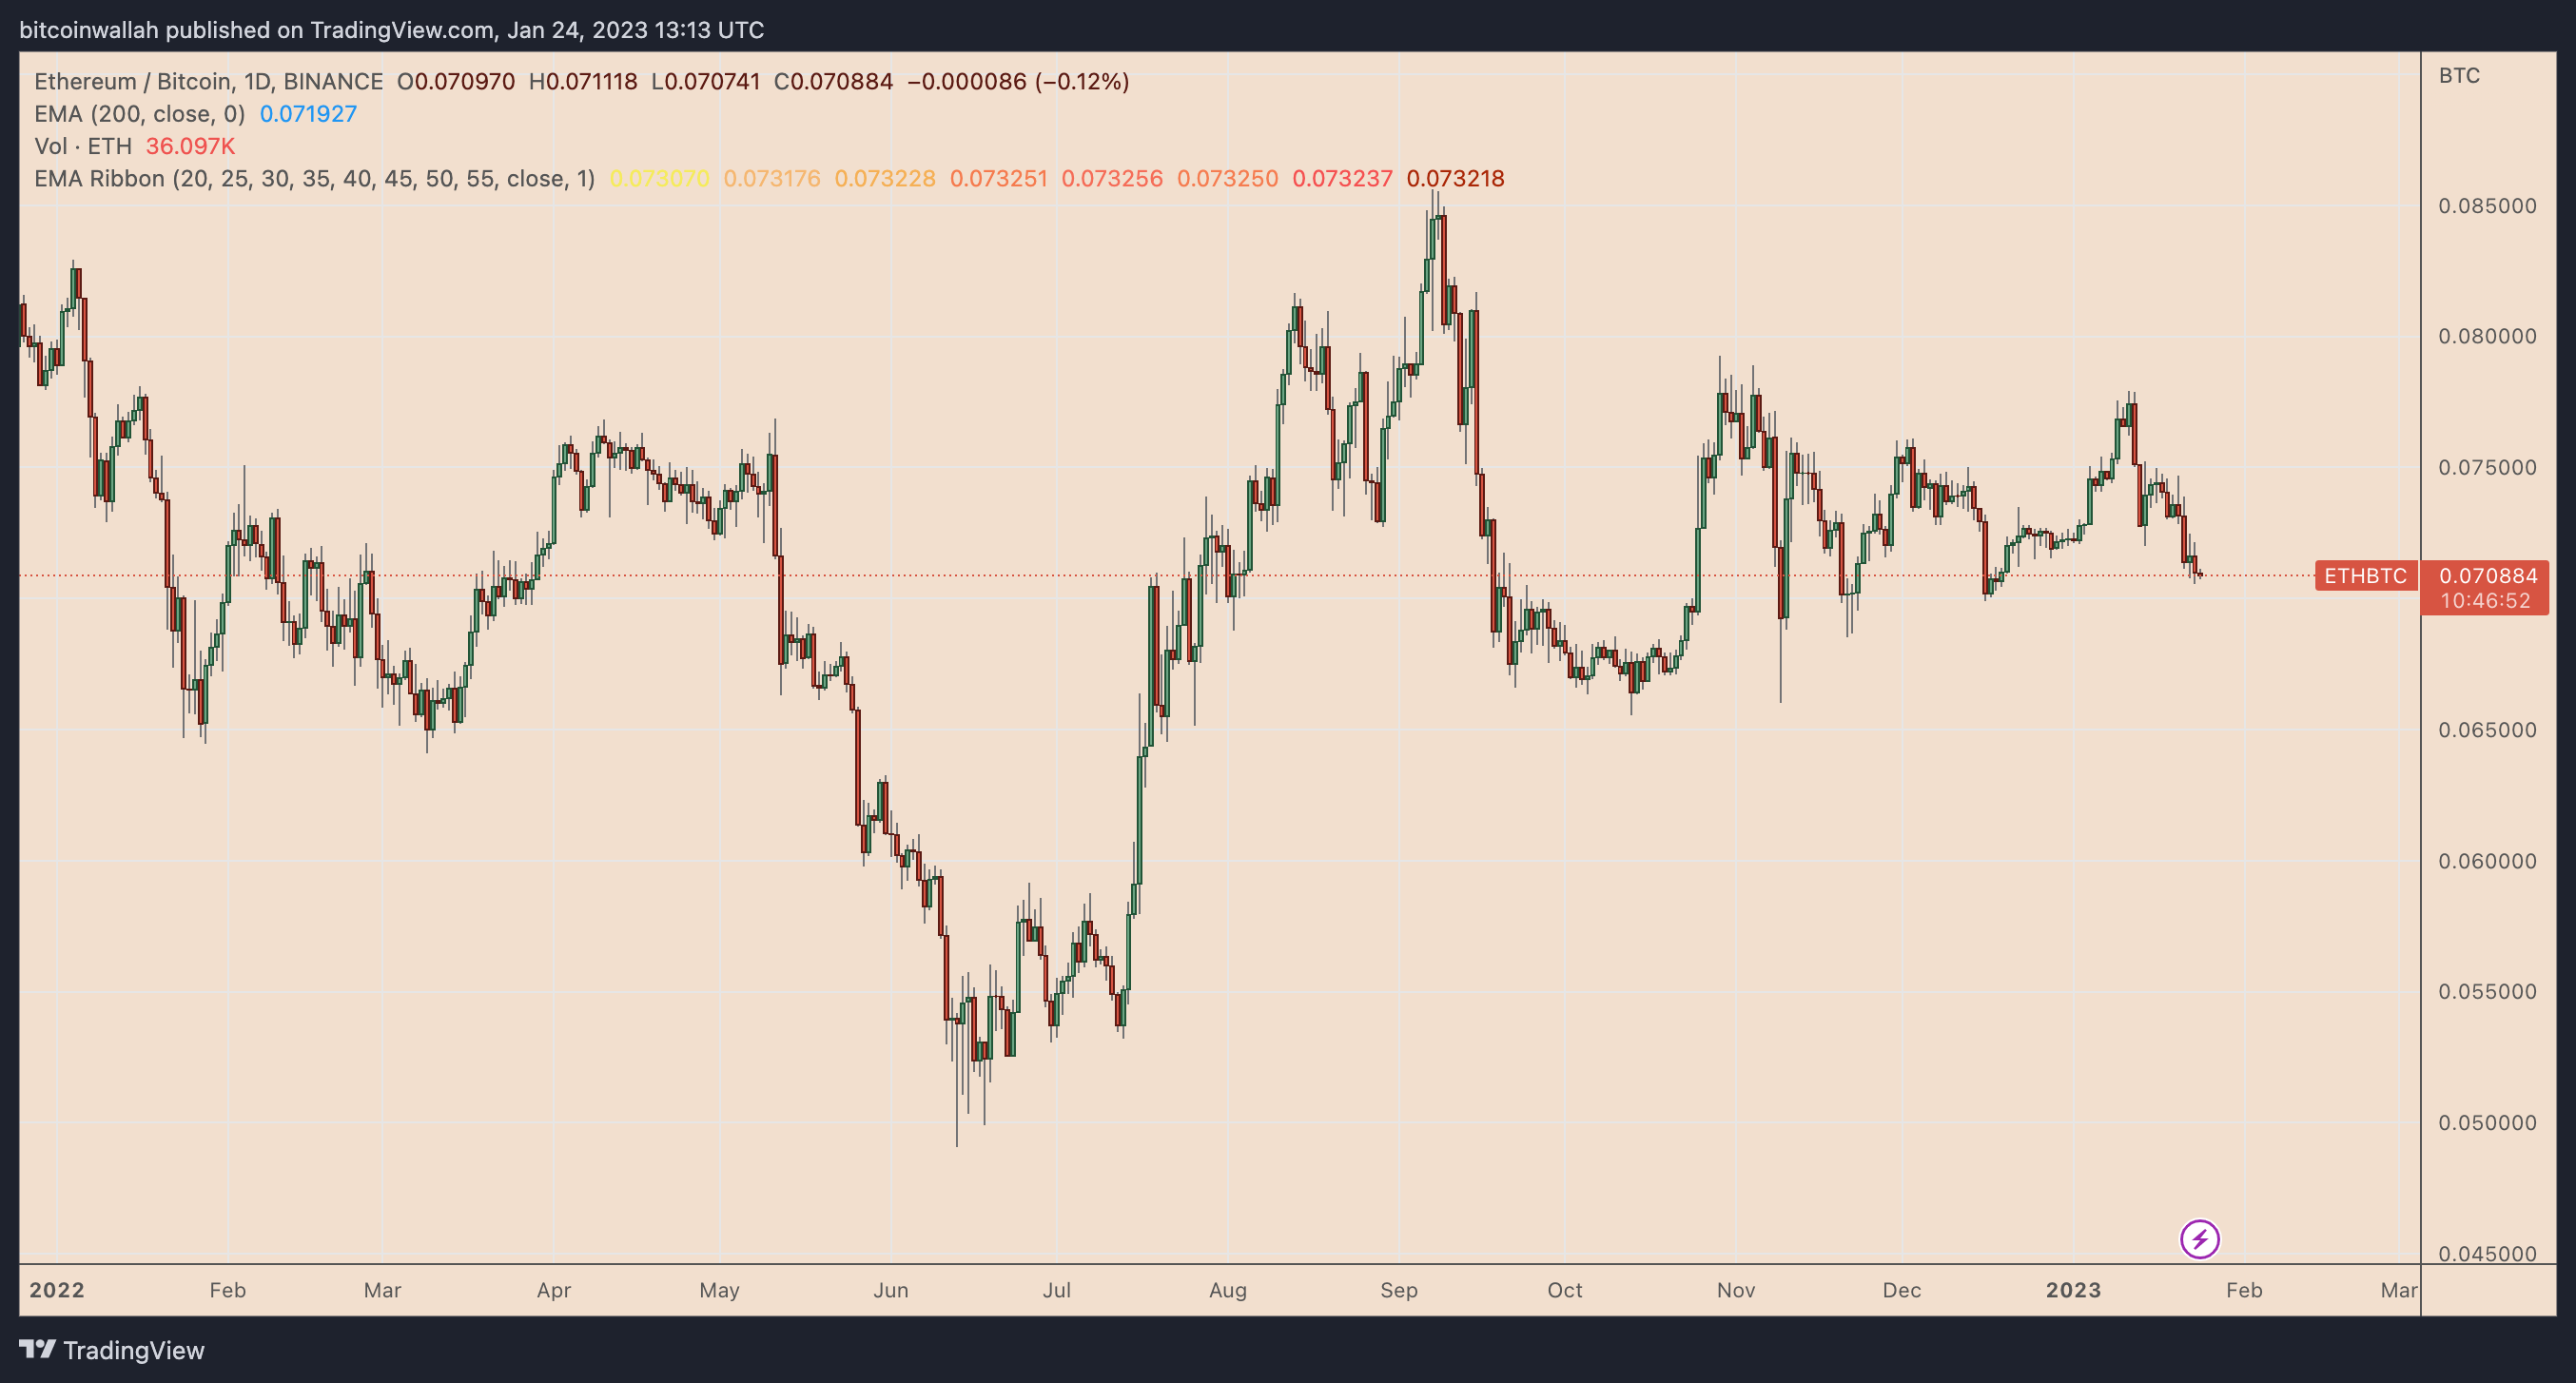 ETH/BTC daily candle price chart. Source: TradingView
Interestingly, Ether’s pullback versus Bitcoin has landed its price at the bottom of its EMA ribbon range, as shown below.
 ETH/BTC weekly candle price chart. Source: TradingView
The EMA ribbon indicator shows numerous exponential moving averages of increasing timeframe on the same price chart. Dropping below the ribbon range increases an asset’s likelihood of seeing an extended down-move.
So in other words, breaking lower would increase its possibility of declining by more than 20% from its current price levels.
Conversely, rising above the ribbon range raises the asset’s chances of a broader rally.
Ethereum price capped by key descending trendline
This week, ETH/BTC dropped to the 55-week exponential moving average (the red wave) – a bottom wave – of its EMA Ribbon indicator, as shown below. Buyers took control near the 55-week EMA, prompting Ether to recover a mere 0.35% versus Bitcoin to 0.0708 BTC on Jan. 24.
Related: This $25K BTC price target would spell misery for Bitcoin shorters
But now, the likelihood of retesting the EMA ribbon bottom is high due to a multi-month descending trendline resistance (black trendline in the chart below), where sellers have been more active as of late.
 ETH/BTC weekly price chart focusing on descending trendline resistance. Source: TradingView
Therefore, one cannot rule out of the possibility of ETH/BTC breaking below the EMA Ribbon range, similar to how the pair did in May 2022 in the wake of the Terra collapse.
Back then, Ether fell by over 25% versus Bitcoin to 0.0490, a level coinciding with its 200-week EMA (the blue wave).
Therefore, if a similar breakdown occurs in the coming weeks, the ETH/BTC pair may test the 200-week EMA near 0.0550 BTC as its primary downside target, or roughly a 20% price drop from current levels.
This article does not contain investment advice or recommendations. Every investment and trading move involves risk, and readers should conduct their own research when making a decision.