Ethereum’s native token Ether (ETH) has grown stronger against its rival for the top position – Bitcoin (BTC) – despite an ongoing crypto market rout. But can the ETH/BTC pair continue to rally in the coming months? Let’s look at the charts.
Ethereum pares YTD losses vs. Bitcoin
ETH/BTC gained 5.5% between the May 9 low of 0.0720 and the May 10 high of 0.0759. ETH also rebounded by almost 9.75% against the U.S. dollar, and Bitcoin underwent a similar upside retracement in the same period.
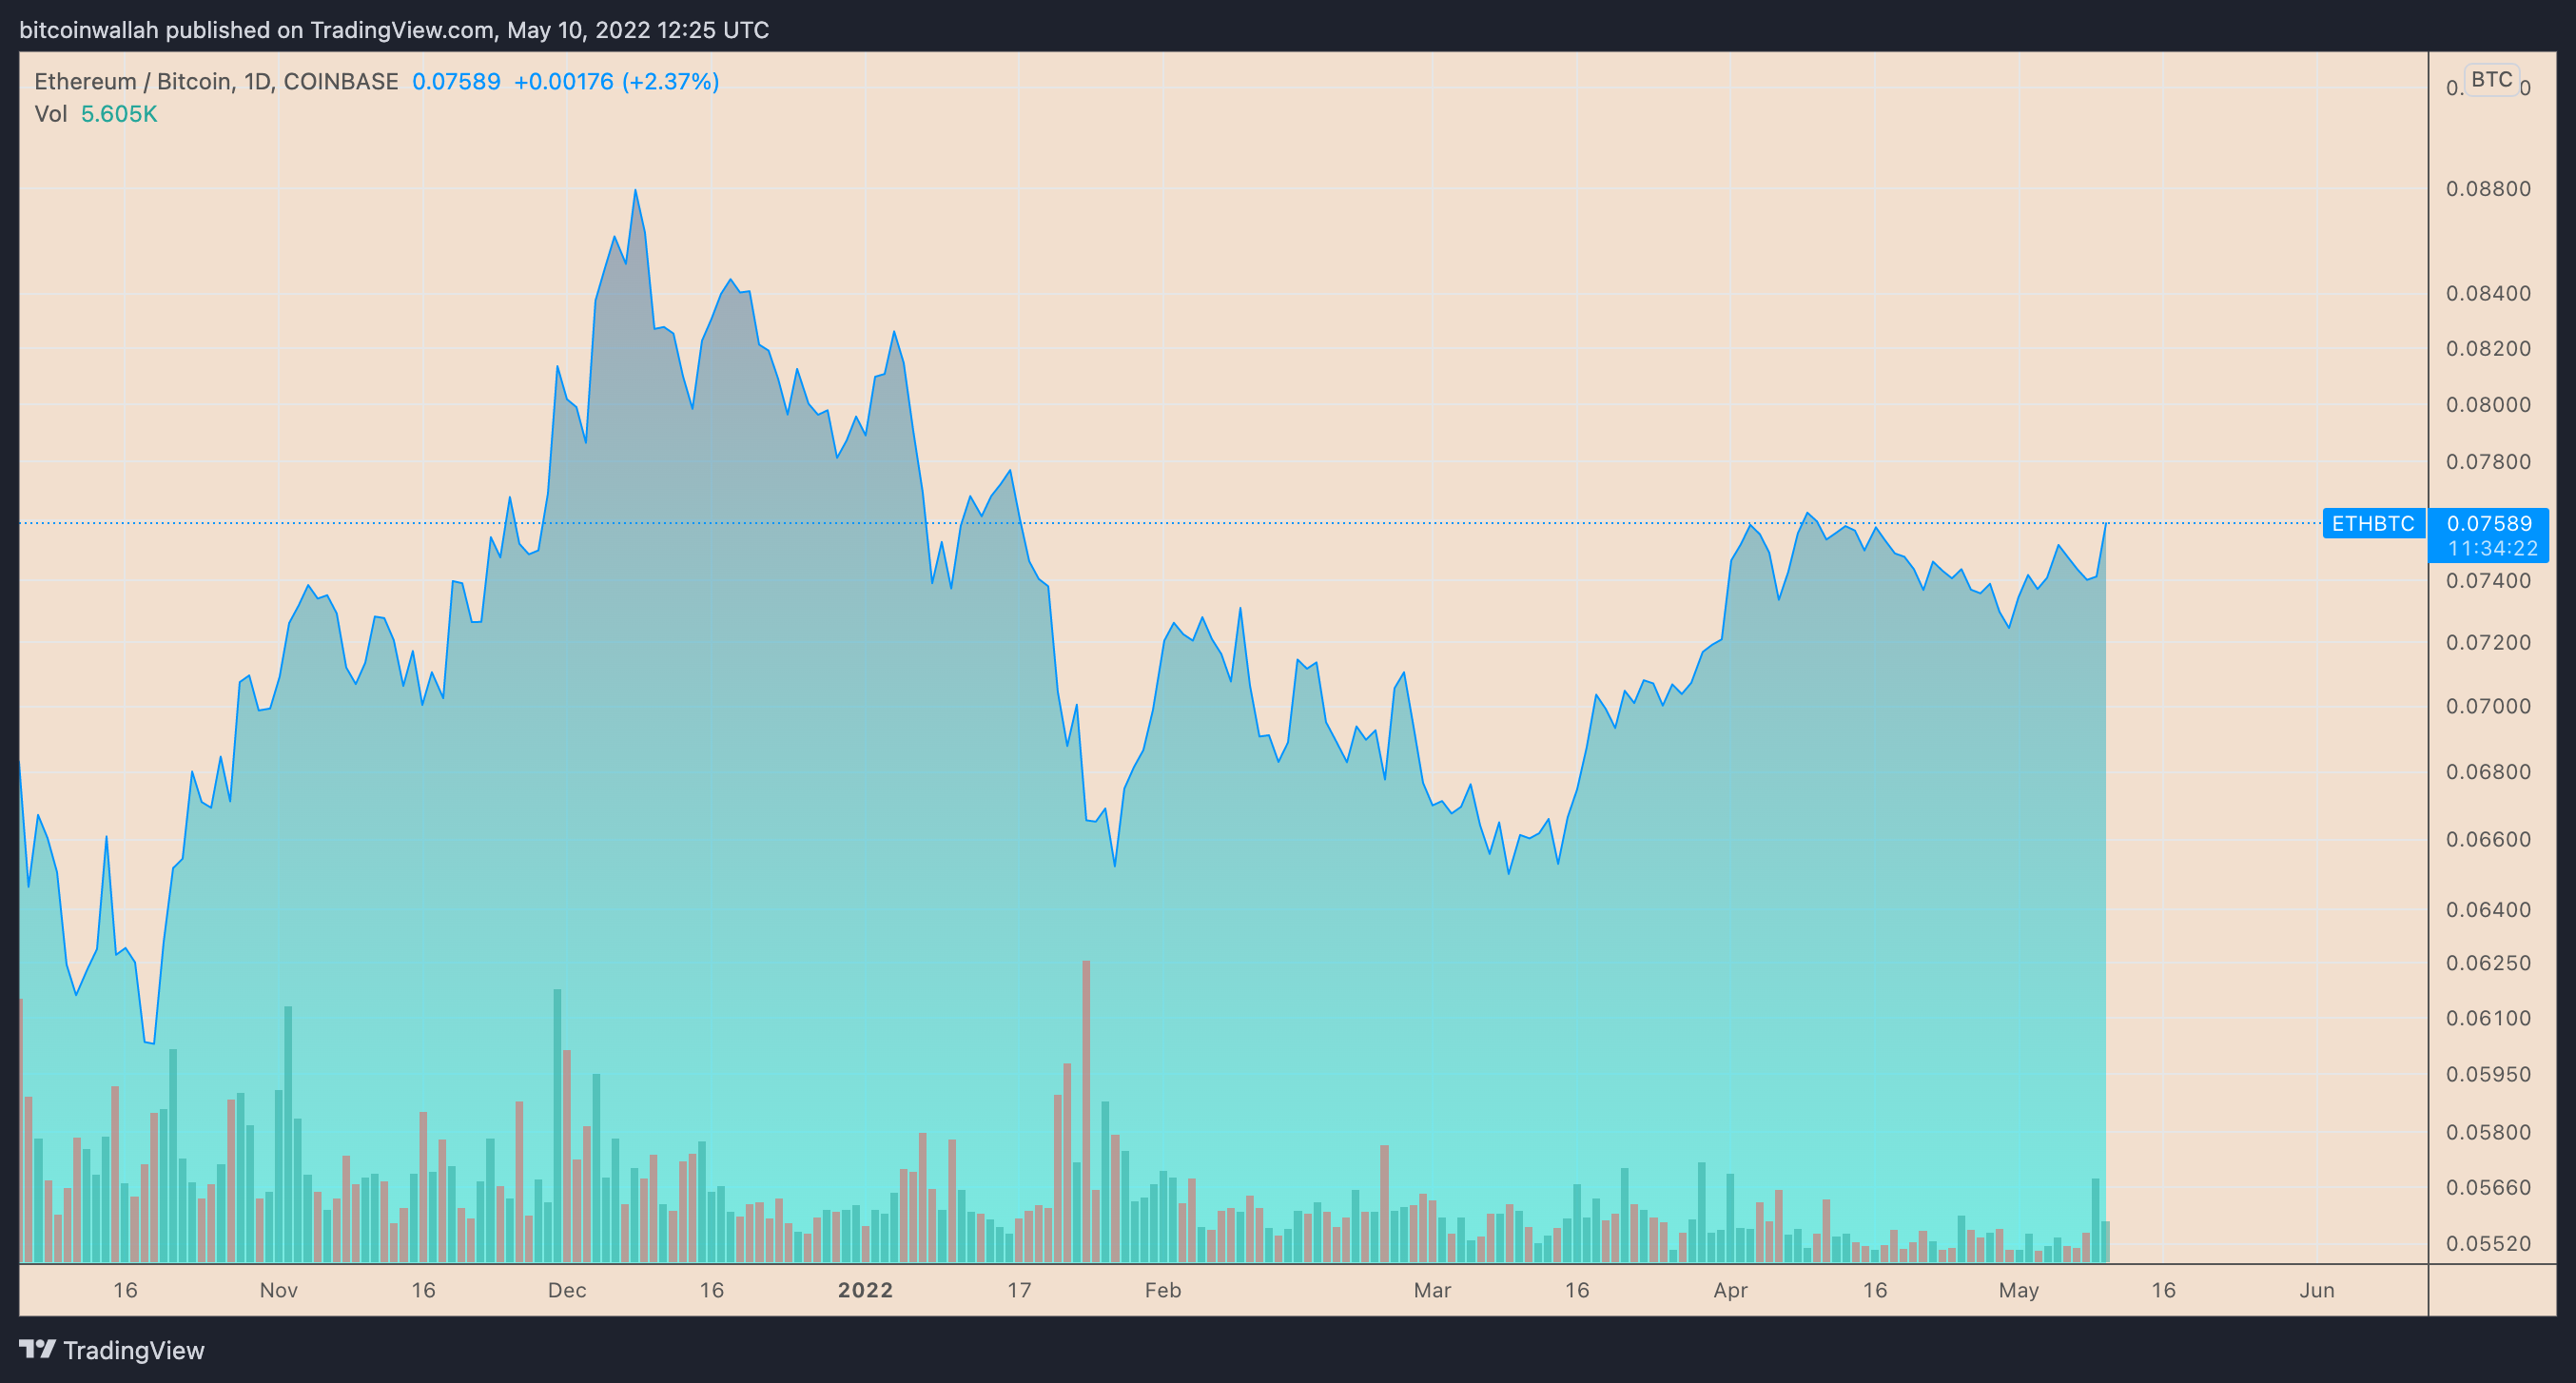 ETH/BTC daily price chart. Source: TradingView
The gains across the pairs appeared after a brutal selloff witnessed across the past 24 hours. The drop sent Ether to its worst levels since January 2022 and Bitcoin below $30,00 for the first time since July 2021.
The situation was similar in the traditional markets, with the U.S. benchmark index, S&P 500 (SPX), slumping 3.2% to its lowest level in 2022.
On the other hand, the dollar reached its two-decade high, reinstating its “safe-haven” status in times of market turmoil. Moreover, the cryptocurrency equivalent USD-pegged stablecoins witnessed a similar surge in demand.
$USDT Exchange Outflow Volume (7d MA) just reached a 3-month high of 34,010,868.697 USDT
View metric:https://t.co/D90kNIpU2J pic.twitter.com/Xzb5DEXaqs
– glassnode alerts (@glassnodealerts) May 10, 2022
ETH price technicals hint at breakout
ETH/BTC’s gains brought its close to testing its multi-month horizontal trendline as resistance, which appears to constitute an “ascending triangle” pattern.
Ascending triangles are typically trend continuation patterns, meaning they send the price in the direction of its previous trend.
 ETH/BTC weekly price chart featuring ‘ascending triangle’ breakout. Source: TradingView
As a rule of technical analysis, a decisive breakout above the triangle’s upper horizontal trendline shifts traders’ profit target to a length equal to the structure’s maximum height.
ETH/BTC eyes a similar breakout move above its horizontal trendline resistance near 0.110 BTC, up over 50% from May 10’s price.
Related: Analyst claims that exchanges sell your Bitcoin, crypto trading platforms respond
Conversely, an upside rejection near the horizontal trendline could have ETH/BTC pursue a pullback move towards the triangle’s rising lower trendline, also coinciding with its 50-week exponential moving average (50-week EMA; the red wave) near 0.067. That is down 11.25% from May 10’s price.
The views and opinions expressed here are solely those of the author and do not necessarily reflect the views of Cointelegraph.com. Every investment and trading move involves risk, you should conduct your own research when making a decision.