Bitcoin (BTC) clung to $29,000 at the May 27 Wall Street open as crucial support levels lay just hundreds of dollars from spot price.
 BTC/USD 1-day candle chart (Bitstamp). Source: TradingView
Trader demands higher low above $28,000
Data from Cointelegraph Markets Pro and TradingView confirmed volatility once again waning in a frustrating week’s price action.
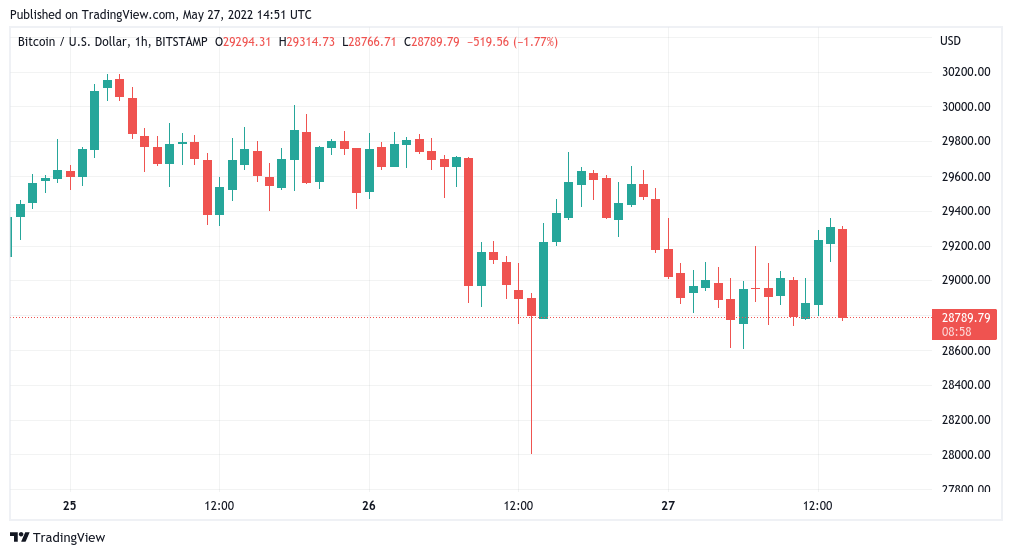
BTC/USD found itself in a tight corridor on the day, and for Cointelegraph contributor Michaël van de Poppe, it would not take much deviation to disrupt the status quo.
“Technically speaking, when it comes to Bitcoin, you clearly want to see a higher low happening here, and if that we happens, we can start seeing continuation,” he said in his latest YouTube update.
Levels to hold now were nearby – $28,600 and $28,200 in order to avoid a rematch of the week’s $28,000 low and risk giving up the chance of a higher low construction.
“If that is lost, then I’m going to expect ourselves to get towards $26,000 as then we’re going to start cascading south even more,” he concluded.
Equally wary was commentator Bob Loukas, who eyed the Bollinger Bands volatility indicator on the day to warn of potential incoming upset.
$BTC – Weak and not a good look there, no urgency, with that primary trend lower.
Should have seen at least a rally early in the cycle, coming of some capitulation. Stay safe. pic.twitter.com/fYfZka2R1C
– Bob Loukas (@BobLoukas) May 27, 2022
Across social media, the sense that a capitulatory move was coming for crypto prevailed, this having characterized sentiment throughout recent weeks.
In-profit supply favors bears
Meanwhile, looking at the network as a whole fueled concerns that current prices could not endure.
Related: Small Bitcoin whales may be keeping BTC price from ‘capitulation’ – analysis
Analyzing the percentage of the supply in profit, Kripto Mevsimi, a contributing analyst at on-chain analytics platform CryptoQuant, drew bearish conclusions.
Currently, around 55% of the supply was in profit, he explained, and compared to historical behavior, more price capitulation should enter in order to provide some guarantee of a macro bottom.
First, however, there should be a sideways period for BTC/USD which precedes the final dip. This would make current price performance chime with the 2018 bear market and the March 2020 crash.
“Next; 2-3 months of boring price action. Then last capitulation possible with %30-%50 additional price drop,” he summarized.
An accompanying chart compared the three phases beginning with the 2017 high of $20,000.
 Bitcoin supply in profit vs. BTC/USD annotated chart. Source: CryptoQuant
The views and opinions expressed here are solely those of the author and do not necessarily reflect the views of Cointelegraph.com. Every investment and trading move involves risk, you should conduct your own research when making a decision.