Bitcoin (BTC) spiked to one-week highs on July 17 amid warnings that traders should not trust current BTC price action.
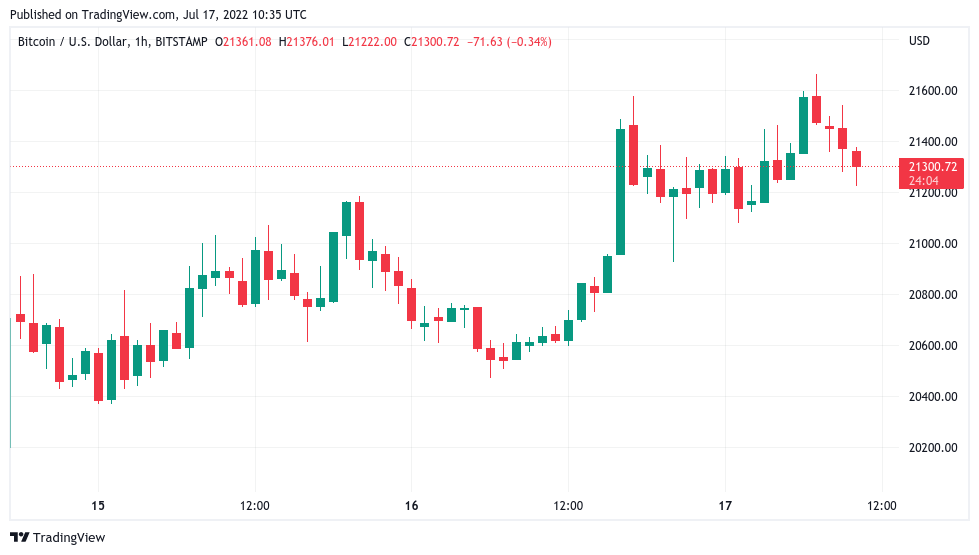 BTC/USD 1-hour candle chart (Bitstamp). Source: TradingView
Binance inflows see multi-week high
Data from Cointelegraph Markets Pro and TradingView showed BTC/USD reaching $21,600 on Bitstamp, its best performance since last Sunday.
The pair saw a fresh leg up during the weekend, this nonetheless coming on the back of thin, retail-driven “out-of-hours” liquidity with institutions out of the picture.
Weekend pumps typically are not to be trusted
Let’s see how this one holds going into the weekly close tomorrow
– Rager (@Rager) July 16, 2022
With Bitcoin prone to “fakeout” moves both up and down in such conditions, there was thus little appetite to believe that current trajectory would endure as the weekly close loomed.
“Don’t let CT noise change your vision of how things really are,” popular social media account, Il Capo of Crypto, told followers on the day, referencing Crypto Twitter narratives.
“Not worried about this scam pump. Still fully out of the market, soon you will see why.”
Also preparing to exit the market, it appeared, were traders, as major exchange Binance saw heightened inflows in the 24 hours to the time of writing.
According to data still being compiled from on-chain analytics platform CryptoQuant, on July 17, inflows neared 17,500 BTC, the most on a single day since June 22.
 Binance BTC inflows chart. Source: CryptoQuant
Nonetheless, some commentators remained upbeat on the short-term outlook. Cointelegraph contributor Michaël van de Poppe, who had called for $21,200 to break for upside to continue, got his wish as the market picked up overnight.
“Overall, strength is still there and I’m assuming further upside is happening. Crucial barrier for now; $21K,” he had explained prior to the move.
As Cointelegraph reported, potential upside targets included $22,000 and the 200-week moving average at around $22,600.
The latest order book data from Binance via analytics resource Material Indicators meanwhile showed a fresh wall of buy support clustered at the $21,200 breakthrough point, worth some $20 million.
 BTC/USD order book data chart (Binance). Source: Material Indicators
Weekly close keeps chart narrative fluid
On weekly timeframes, the July 17 close had the potential to be significant.
Related: Bitcoin is now in its longest-ever ‘extreme fear’ period
At $21,300, Bitcoin would not only seal its second “green” weekly candle but also its highest weekly close since early June.
 BTC/USD 1-week candle chart (Bitstamp). Source: TradingView
A matter of $500 nonetheless stood between that outcome and continuation of the downward trend, since the July 10 close had come in at around $20,850.
That event, popular trader and analyst Rekt Capital noted at the time, marked a lower high for the week, alongside “declining buy-side volume.”
The new #BTC Weekly Close shows that price has formed a new Lower High on declining buy-side volume$BTC #Crypto #Bitcoin pic.twitter.com/WqrnHgMQjK
– Rekt Capital (@rektcapital) July 11, 2022
The views and opinions expressed here are solely those of the author and do not necessarily reflect the views of Cointelegraph.com. Every investment and trading move involves risk, you should conduct your own research when making a decision.